Delphi, C++ Builder & .NET Part of sgcUI

sgcDashboard, Dashboards and KPI Cards for Delphi, C++ Builder & .NET

Build a business dashboard without layout code. Drop tiles on a 12 column grid, put a KPI card, a chart, a map or a report preview in each one, switch the whole screen to a dark theme with one property, and let users drag, resize and save their own layout.

VCL, FireMonkey, WinForms, WPF, Avalonia12 column tile grid with auto-flowKPI cards as PNG or SVG, Linux64 tooIncluded in sgcUI Professional
Basic demo: dashboard tiles and KPI cards in a responsive grid

Everything a Dashboard Needs

Eleven capabilities in four groups, with the real component and property names and a link to each help topic. Features marked Registered are not in the free .NET Community build.

Layout and content

A grid that places tiles for you, and cards that show the numbers.

sgcDashboard Basic demo with six tiles and four KPI cards on the 12 column grid

Layout and content

A responsive tile grid with no layout code

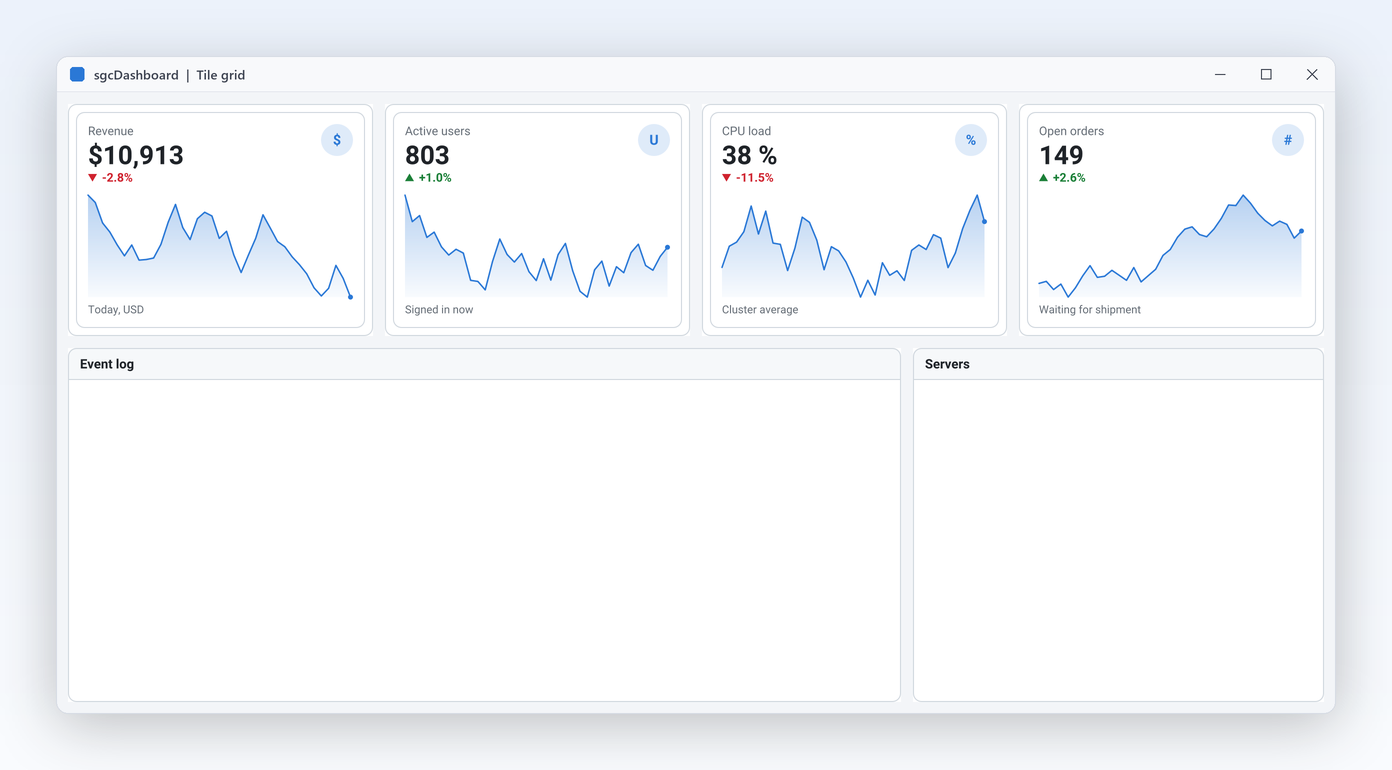
A dashboard is a grid of tiles that must stay tidy at any window size and any DPI. Drop a dashboard on the form, add tiles, and give each one a column, a row and a span. The grid computes column widths from the available width, scales gaps and row heights by the monitor DPI, and scrolls vertically when the tiles need more rows than fit. Overlapping tiles are pushed down a row at a time, never on top of each other. Because the layout lives in one engine, the same tile cells give the same arrangement on VCL, FireMonkey and the .NET views.

  • TsgcVCLDashboard with Columns (default 12), RowHeight (120), Gap and Padding (12)
  • TsgcVCLDashboardTile with Col, Row, ColSpan and RowSpan
  • A hidden tile (Visible False) takes no cell
  • Placed cells and rectangles are readable from Layout.PlacedCell and Layout.Rect
Read the help topic
Dashboard with four KPI tiles with sparklines, an event log and a server list

Layout and content

Add tiles and let auto-flow place them

When the content of a dashboard depends on the user or the data, you do not want to compute coordinates. Leave a tile's column and row at -1 and auto-flow puts it in the first free slot, scanning rows from the top and columns from the left. Fix only the column and the tile drops to the first free row in that column. Mix fixed and flowing tiles on the same dashboard.

  • AutoFlow is on by default; a new tile starts at Col and Row -1 with a 3 by 2 span
  • Explicit cells are placed first, flowing tiles fill the remaining space
  • Spans are clamped so a tile never passes the last column
  • The same layout engine, TsgcDashboardLayout, drives VCL, FireMonkey and .NET
  • Right to left for Arabic and Hebrew: tiles flow from the right and the tile headers and KPI cards are mirrored, while trend arrows and sparklines keep their direction
Read the help topic
Dashboard tiles hosting a map, a PDF viewer and a report preview

Layout and content

Put any control in a tile

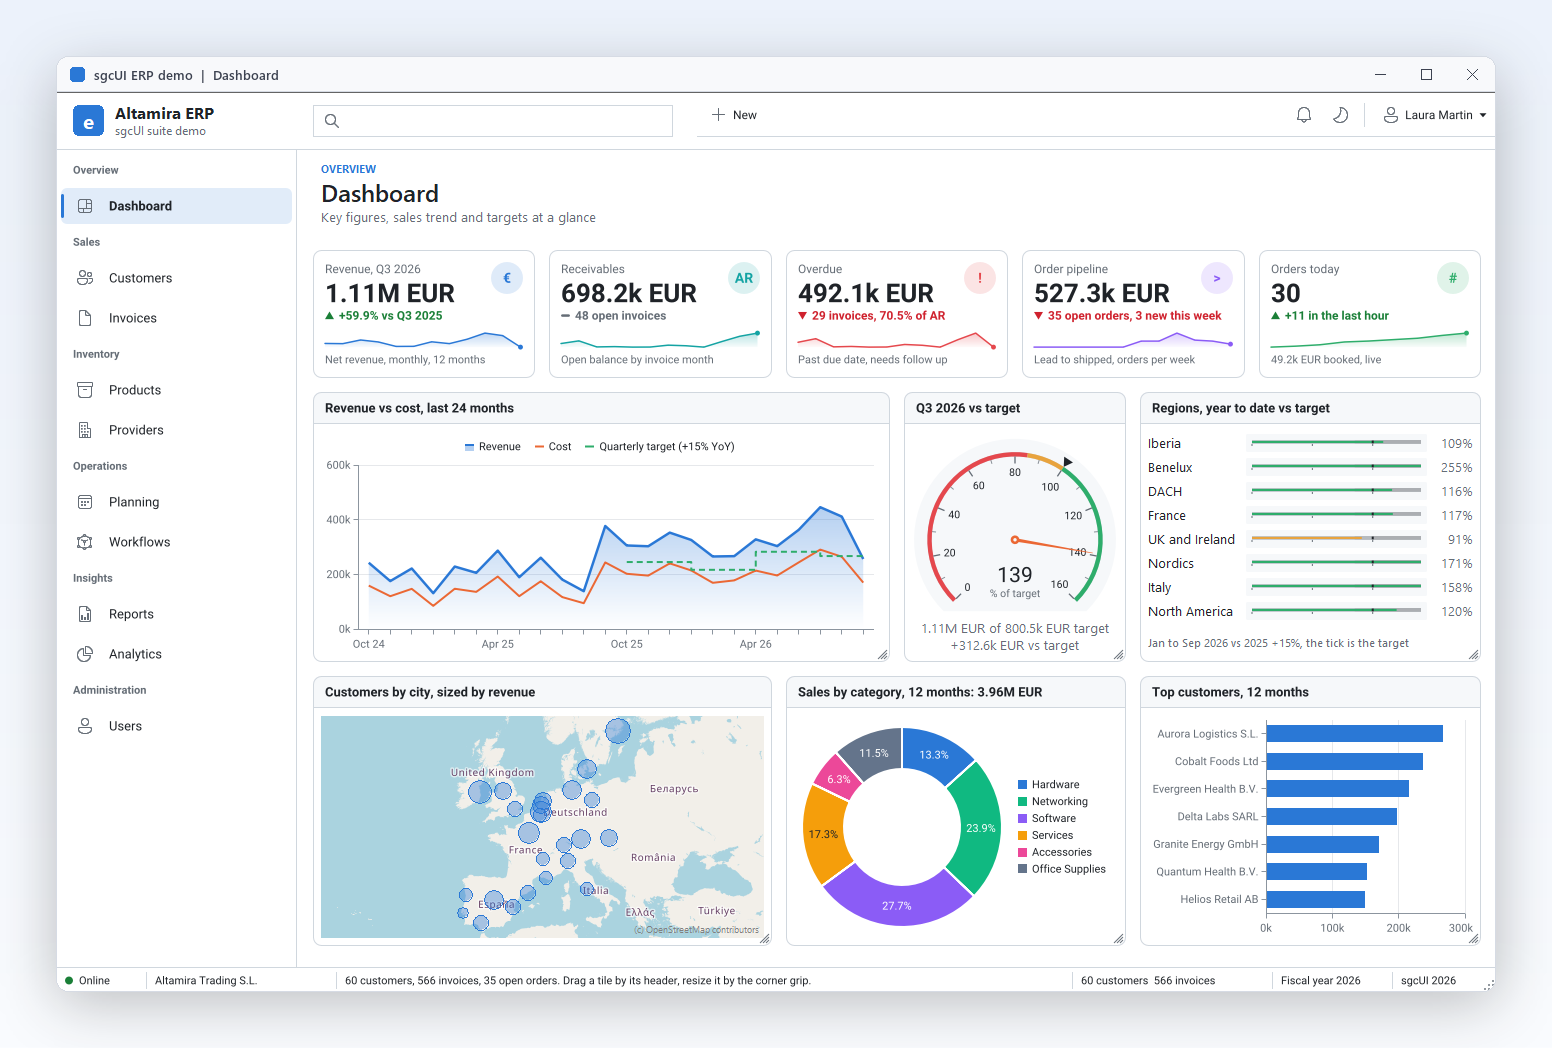
A tile is a container with an optional header, so it hosts whatever your screen needs: a chart, a grid, a map, a PDF viewer, a report preview or a plain memo. Set the control's parent to the tile and align it to the client area. The Suite demo hosts sgcCharts, sgcMaps, sgcPDF and sgcReports in one dashboard, all following the dashboard theme. A tile can drop its header for a clean full bleed chart, or keep it as a title bar. The dashboard grows by rows and scrolls vertically as you add tiles.

  • Title and ShowHeader on every tile
  • ParentTheme lets a tile follow the dashboard or keep its own Theme
  • sgcUI controls inside a tile pick up the light or dark theme
  • Works the same with TsgcFMXDashboardTile on FireMonkey
Read the help topic
Four KPI cards with values, trend arrows and sparklines

Layout and content

KPI cards with trend and sparkline

Every dashboard opens with a row of numbers that matter: revenue, orders, churn, response time. A KPI card shows the value large, an icon, a trend arrow with its text, a footer line and a small sparkline of recent values, in one component. Call AddValue as new figures arrive and the sparkline scrolls; MaxPoints decides how much history it keeps. AccentColor lets you colour a card to match what it measures, and the card follows the light or dark theme of the dashboard it sits in.

  • TsgcVCLKPICard with Title, Value, Icon, FooterText and AccentColor
  • Trend: ktUp, ktDown or ktNeutral, with TrendValue text
  • AddValue, ClearValues and MaxPoints for the sparkline
  • AddValue is thread-safe, so a worker thread can feed it
Read the help topic

User layouts and live data

Let users arrange their own start page and keep it, and feed it from the wire.

User layouts and live data Registered only

Users drag and resize the tiles

On a shared start page every user wants different numbers in front. Turn on dragging and the user moves a tile by its header; turn on resizing and a grip in the corner changes its span. While the mouse moves, the target cell is drawn under the tiles and the tile snaps to the grid. Escape cancels. Tiles you mark as locked never move. Combine it with saved layouts below and every user keeps the start page they arranged, while you still decide which tiles exist.

  • AllowDrag and AllowResize on the dashboard
  • Locked on a tile keeps it in place
  • OnLayoutChanged fires after every drag or resize
  • Same behaviour on the FireMonkey dashboard

Community builds a fixed layout from code; runtime drag and resize are Registered.

Read the help topic

User layouts and live data Registered only

Save each user's layout and restore it

A layout the user arranged must come back after a restart. One call writes the grid metrics and, for every named tile, its cell and visibility as compact JSON; another applies it. Tiles are matched by name, unknown names are ignored, and tiles missing from the text keep their cells, so an older saved layout still loads after you add a tile in a new version. The JSON is small and readable, so you can ship a default layout with the application and offer a reset button that loads it again.

  • SaveLayout and LoadLayout return and apply a JSON string
  • SaveLayoutToFile, LoadLayoutFromFile, SaveLayoutToStream, LoadLayoutFromStream
  • UTF-8 without BOM on save, a BOM is skipped on load
  • Store the string per user in a file, the registry or your database
Read the help topic

User layouts and live data Registered only

Live KPIs straight from the wire

Operations screens show values that change every second. The sgcDashboardWS bridge reads a number out of every JSON message of an sgcWebSockets client and pushes it into a card, sparkline included. The trend arrow follows the previous value by itself. On Delphi 2010 and later the text updates run in the main thread, so the client can use any threading mode. Messages that are not valid JSON, or whose path is not a number, are ignored, so a noisy feed never breaks the screen.

  • TsgcDashboardSource_WebSocket, TsgcDashboardSource_MQTT (with Topic) and TsgcDashboardSource_SSE
  • ValuePath such as data.items[0].value, ValueFormat default %.2f
  • TitlePath and TrendValuePath copy more fields into the card
  • OnValue event after each update

The bridge needs sgcWebSockets. In Community, feed cards from code with Value and AddValue.

Read the help topic

Themes, images and platforms

One look across the screen, the same cards as images, the same design on every target.

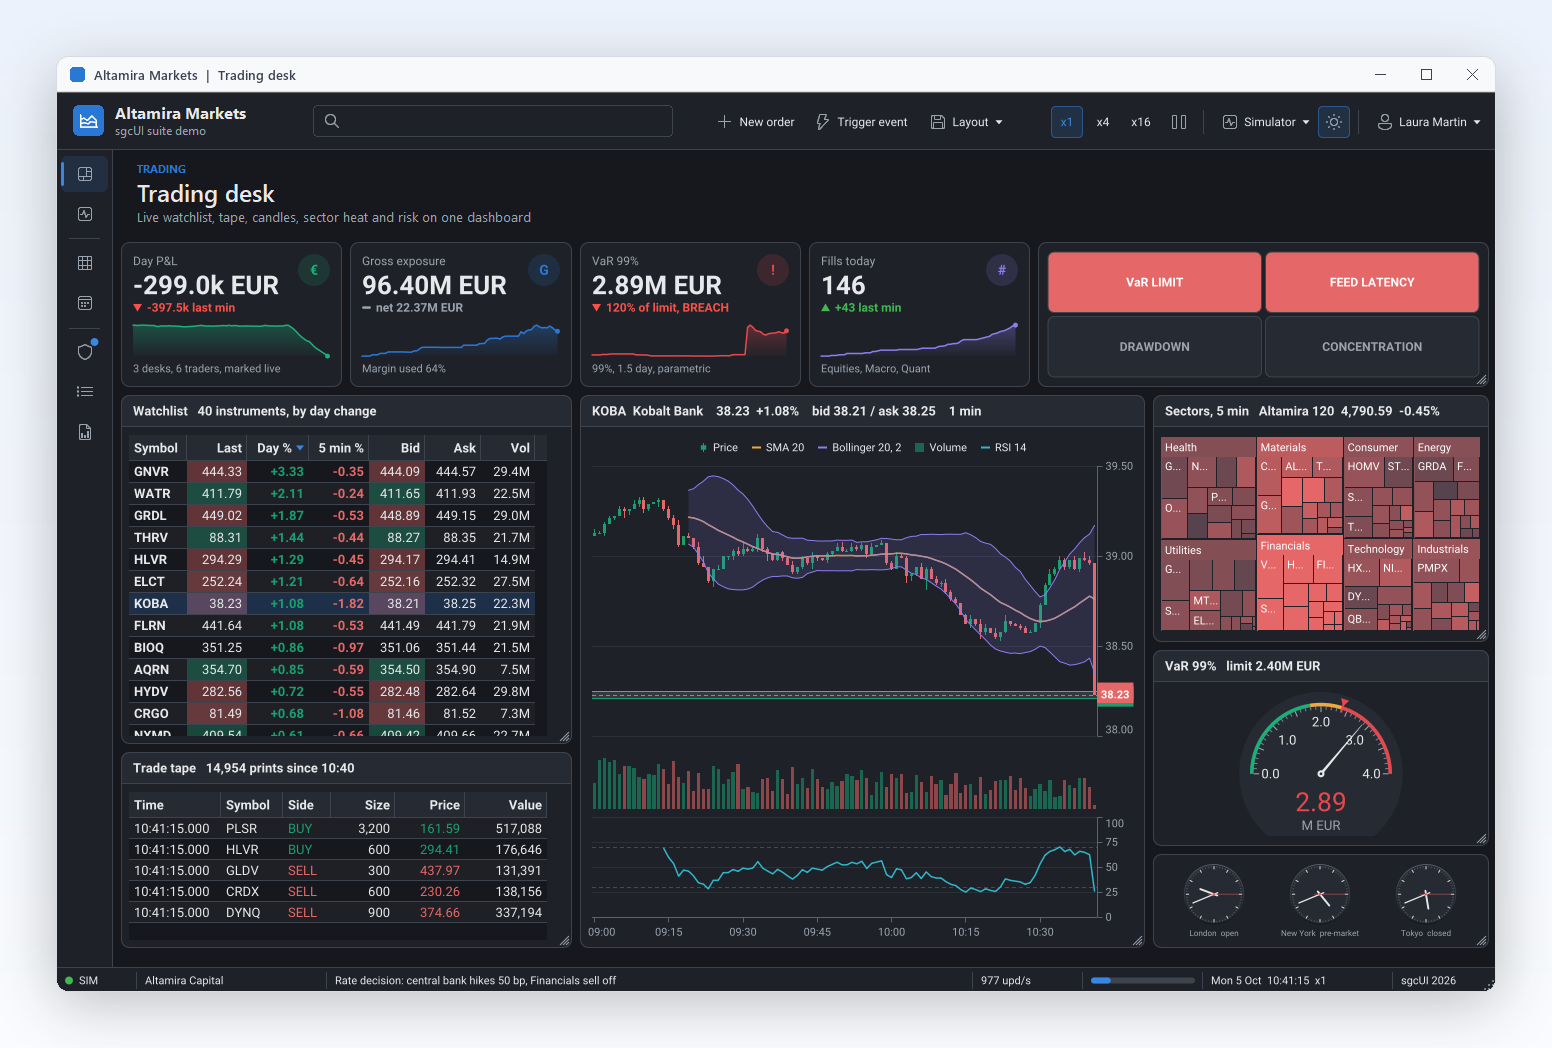
sgcDashboard tiles with KPI sparklines, a live chart, a map, a PDF viewer and a report preview in the dark theme

Themes, images and platforms

One property themes the whole dashboard

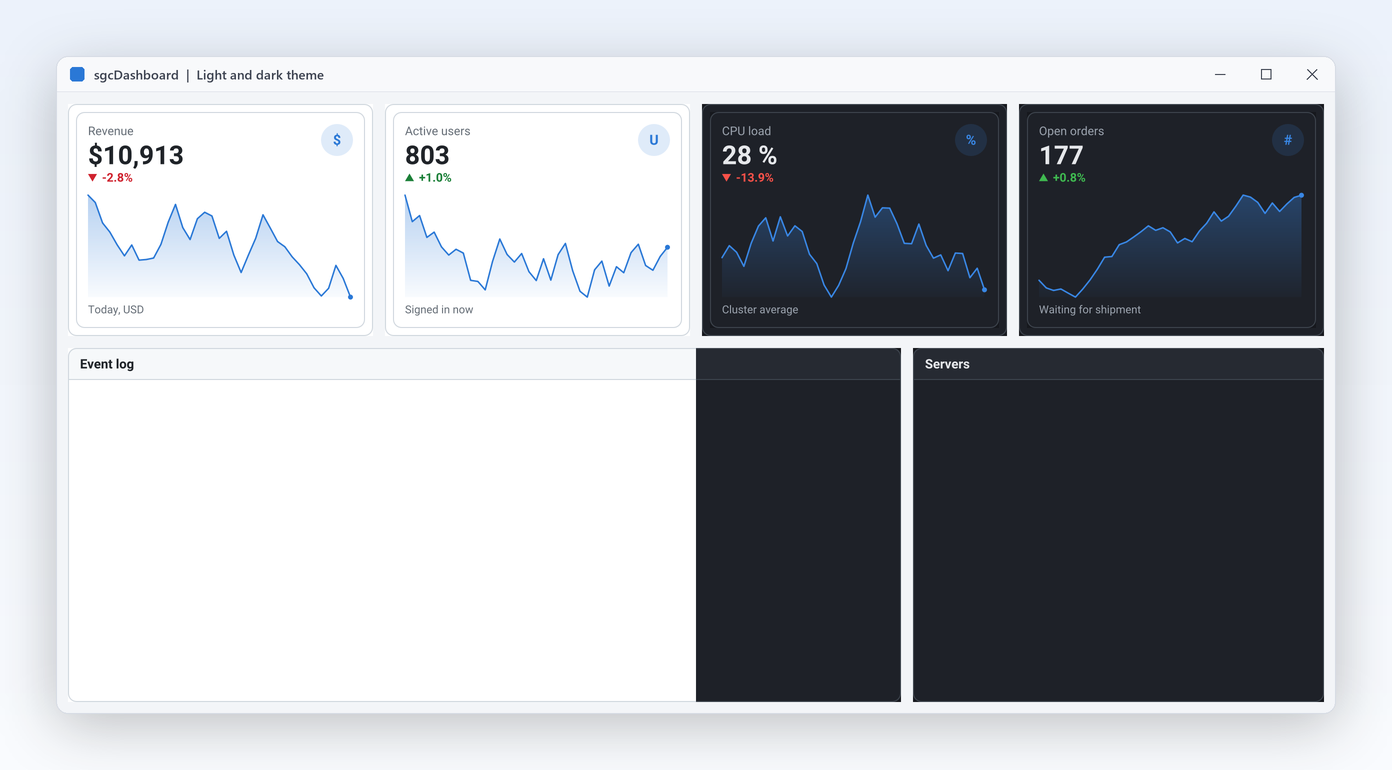
A dark control room and a bright office need the same screen in two looks. Set the dashboard theme and it reaches every tile, every KPI card and the sgcUI controls inside them, so charts, gauges and grids switch together. The theme type is the same one every sgcUI product uses, so a whole application can follow one setting. Tiles that need to stand out can keep a theme of their own while the rest of the dashboard follows the global one.

  • Theme := utDark or utLight on the dashboard
  • Tiles follow with ParentTheme, or keep their own Theme
  • KPI cards and headless KPI images use the same palette
  • Change it at runtime, for example from a day and night switch
Read the help topic

Themes, images and platforms

KPI cards as images for e-mail and web

The numbers on the dashboard are often wanted elsewhere: in the morning report e-mail, on an intranet page or in a PDF. TsgcDashboardKPI renders the same card with no window and no VCL or FireMonkey, so a console program, a Windows service or a Linux64 server can produce it. Width and height are logical pixels and a scale factor gives sharp high DPI images. Use it for scheduled reports: build the cards from the same queries your dashboard uses and attach the images to the message.

  • SaveToPNG to a file or stream, for example 320 by 160 at scale 2 for a 640 by 320 image
  • SaveToSVG for crisp vector output
  • Card.KPI.SaveToPNG saves what an on screen card shows
  • Builds on every platform, Linux64 included
Read the help topic

Themes, images and platforms

The same dashboard on desktop, mobile and .NET

Write the dashboard once and reuse the design. The FireMonkey dashboard, tiles and KPI cards run on Windows, macOS, iOS and Android, and the .NET port offers the same classes for WinForms, WPF and Avalonia. Because one layout engine computes the cells everywhere, a saved layout means the same thing on every target. The demos ship in the same set for every target: Basic, LiveKPI, SaveLayout and Suite for Delphi and C++ Builder, plus WinForms, WPF and Avalonia versions in .NET.

  • TsgcFMXDashboard, TsgcFMXDashboardTile, TsgcFMXKPICard
  • TsgcWinFormsDashboard, TsgcWinFormsKPICard and their WPF and Avalonia twins
  • Delphi 7 to 13 VCL, FireMonkey from XE6, C++ Builder 2007 to 13
  • .NET Framework 4.7.2, .NET 8, .NET 9 and .NET 10
Read the help topic

Accessibility

UI Automation for screen readers, the keyboard and high contrast, with no setup.

Accessibility

Move through tiles and rearrange them without a mouse

sgcDashboard exposes the dashboard and its tiles to Microsoft UI Automation with their titles and position, the control hosted in each tile, and the KPI cards with title, value, unit and trend.

  • Arrows move between tiles, Home and End go to the first or last tile and Enter moves the focus into the focused tile
  • Ctrl+Shift+Arrows move the tile (AllowDrag) and Alt+Shift+Arrows resize it (AllowResize), unless the dashboard is locked
  • The dashboard is a tab stop and shows a visible focus ring
  • Under a Windows high contrast theme the tile chrome uses the system colours, and the accent and trend colours of the KPI cards are replaced by system colours

Accessibility is on by default in every edition, the free Community edition included, on VCL in every Delphi and C++Builder version from Delphi 7 to Delphi 13, on FireMonkey on Windows, and on WinForms, WPF and Avalonia. In Delphi and C++Builder, AccessibleName and AccessibleDescription set the name and the description exposed to UI Automation, and in .NET the standard accessible name and help text of each framework do the same. See the accessibility conformance reports.

Read the help topic

See sgcDashboard in action

sgcDashboard inside the sgcUI suite demos: complete applications that run offline with built-in simulated data.

Who Builds with sgcDashboard

Executive and sales dashboards in an ERP

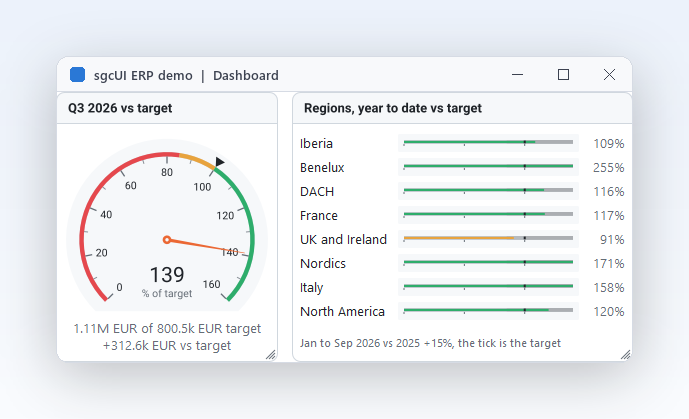
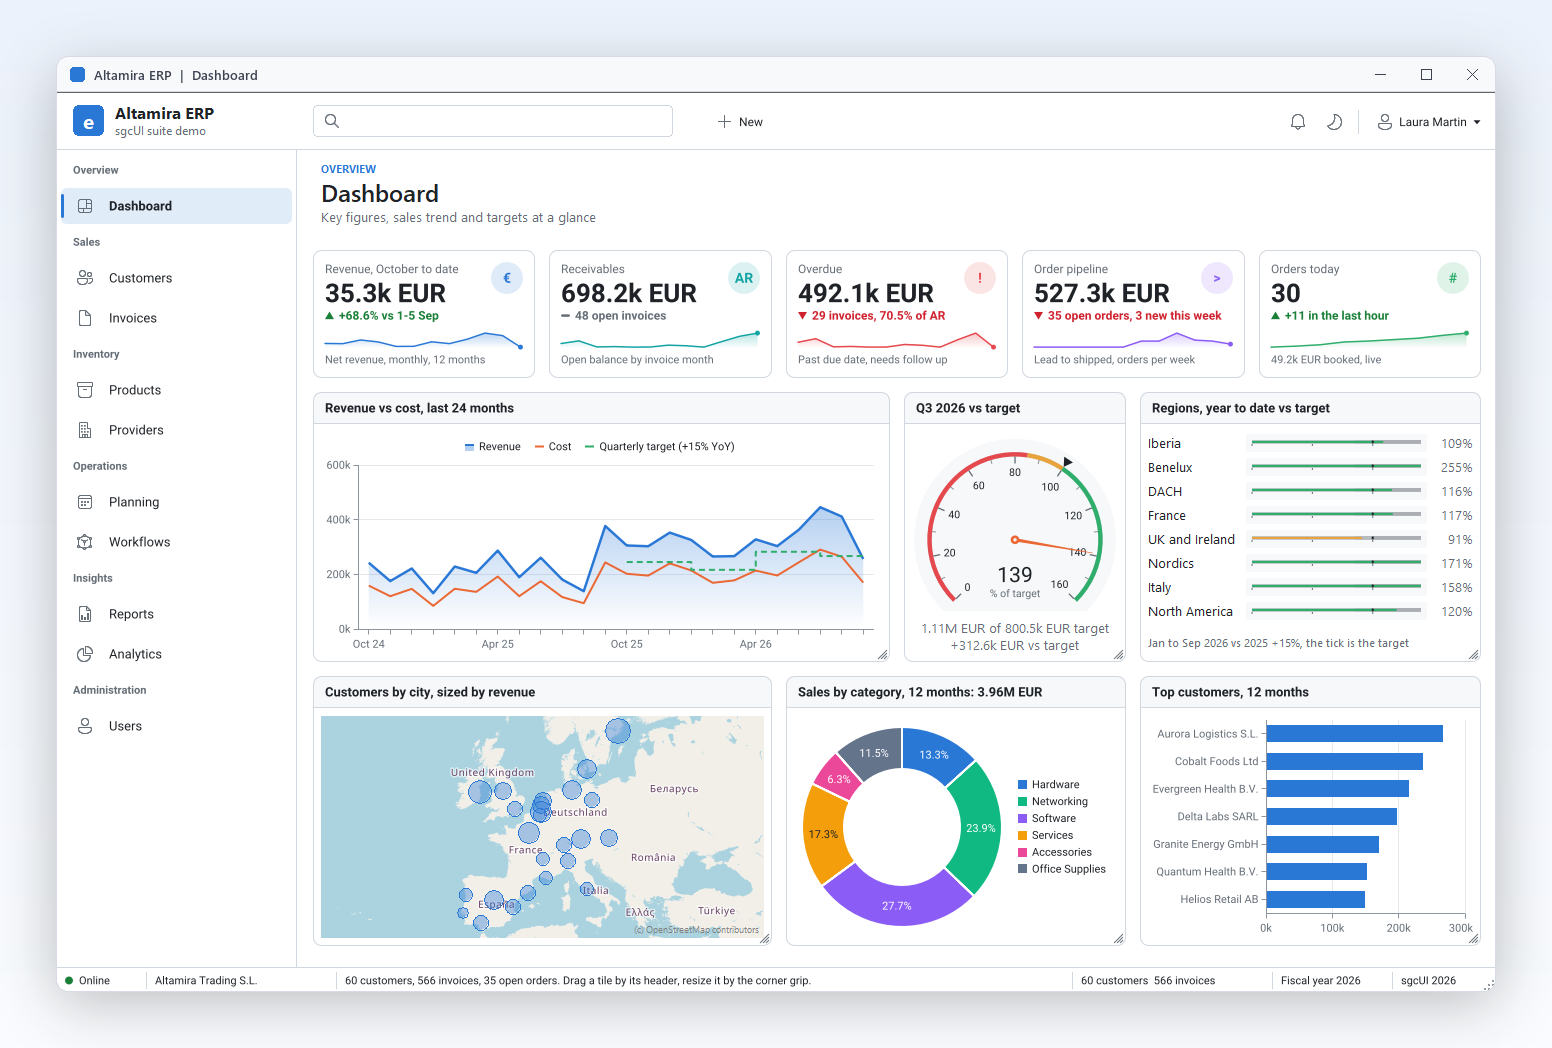
The start page of an ERP shows revenue, open orders, overdue invoices and churn as KPI cards with trend arrows, a sales chart and a top customers grid in tiles below. Every night a service renders the same cards as PNG for the management e-mail, with the same numbers and colours as on screen.

  • KPI cards
  • Any control in a tile
  • Headless KPI images
  • Themes
Run the Suite demo

Operations and IoT control rooms

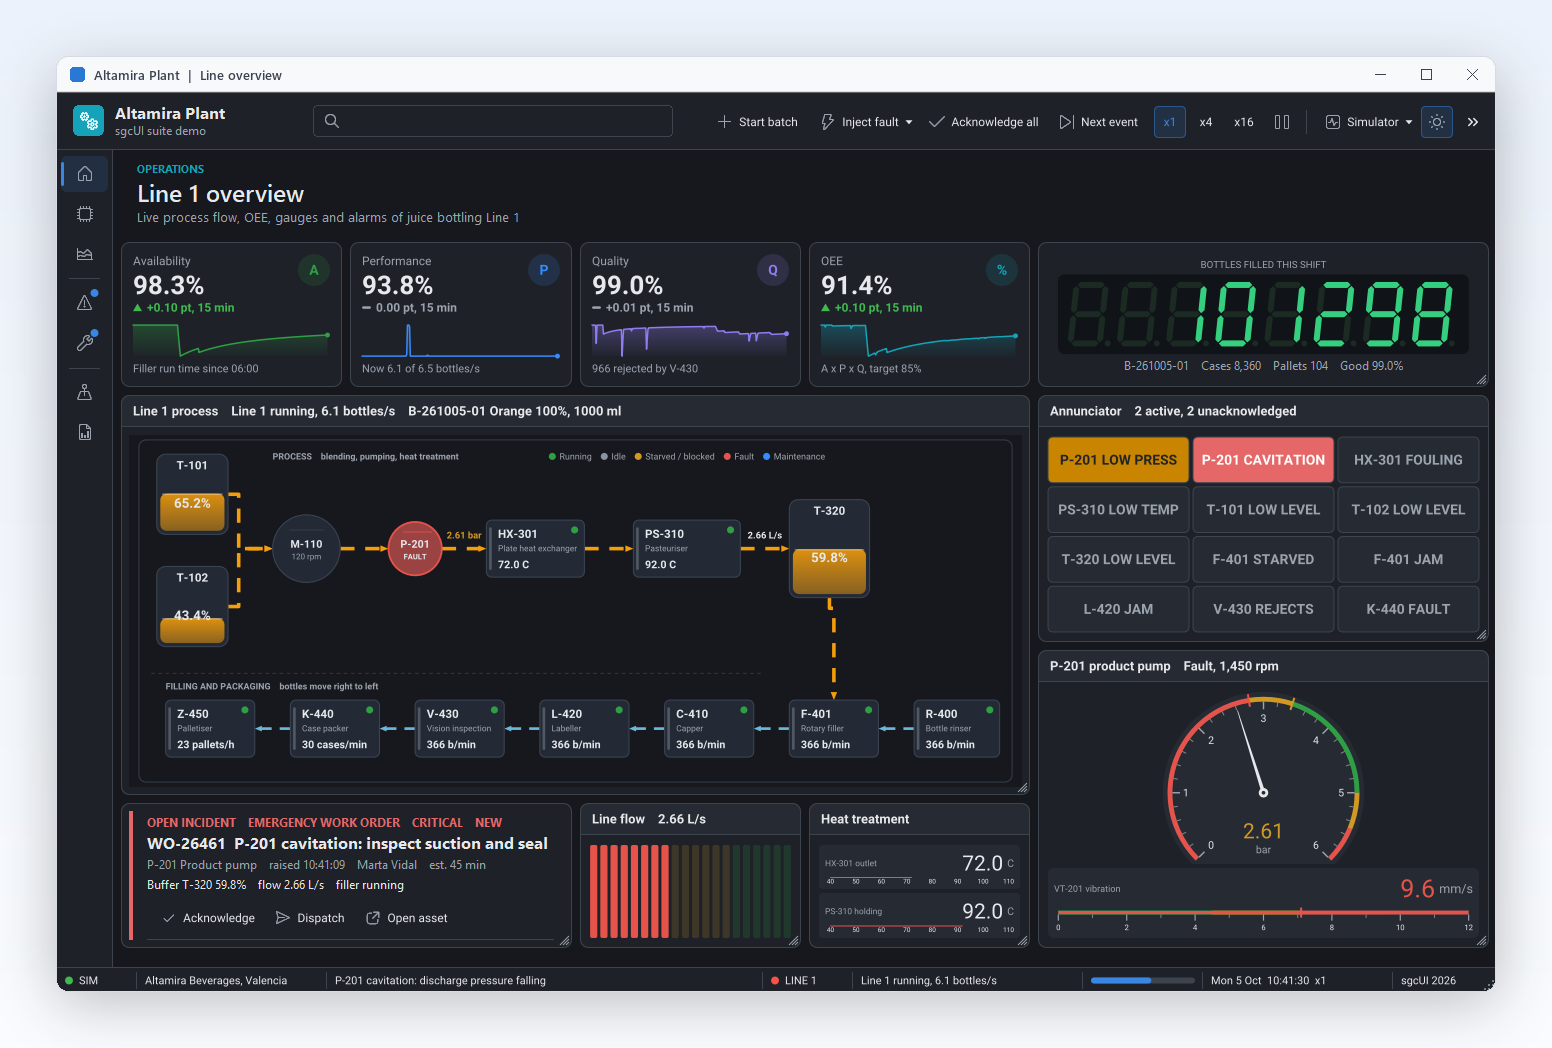
A wall screen in a plant shows line throughput, temperatures and alarm counts. MQTT sources push each reading into its card as it arrives, the sparklines show the last minutes, and a dark theme keeps the room calm at night. Gauges and charts in neighbouring tiles follow the same theme.

  • MQTT source
  • Sparklines
  • Dark theme
  • Gauges in tiles
Run the LiveKPI demo

Personal start pages in desktop SaaS clients

In a desktop client used by many roles, each user drags the tiles that matter to the top, resizes the chart they watch most and hides the rest. The layout is saved as JSON per user and restored at the next login, and new tiles added in an update simply flow into free space.

  • Drag and resize
  • SaveLayout and LoadLayout
  • Auto-flow
Run the SaveLayout demo

A KPI Dashboard in a Few Lines

The same API in Delphi, C++ Builder and C#: tiles on the grid, a KPI card with a sparkline in each, a dark theme and a saved layout. Dragging and layout files need the Registered edition.

Tiles on the 12 column grid with a KPI card in each, a dark theme, and the layout saved to a file. Dragging and layout files need the Registered edition.

uses
  SysUtils, Controls, sgcUICore_Theme, sgcDashboard_KPI, sgcDashboard_VCL, sgcDashboard_KPI_VCL;
procedure AddKPI(aDash: TsgcVCLDashboard; const aName, aTitle, aValue,
  aChange: string; aCol: Integer; aTrend: TsgcDashboardKPITrend);
var
  oTile: TsgcVCLDashboardTile;
  oCard: TsgcVCLKPICard;
begin
  oTile := TsgcVCLDashboardTile.Create(aDash.Owner);
  oTile.Name := aName;
  oTile.Parent := aDash;
  oTile.Col := aCol;
  oTile.ColSpan := 4;
  oTile.Title := aTitle;
  oCard := TsgcVCLKPICard.Create(aDash.Owner);
  oCard.Parent := oTile;
  oCard.Align := alClient;
  oCard.Value := aValue;
  oCard.Trend := aTrend;
  oCard.TrendValue := aChange;
  oCard.AddValue(47);
  oCard.AddValue(52);
end;
procedure BuildDashboard(aOwner: TWinControl);
var
  oDash: TsgcVCLDashboard;
begin
  oDash := TsgcVCLDashboard.Create(aOwner);
  oDash.Parent := aOwner;
  oDash.Align := alClient;
  // drag, resize and layout files need the Registered edition
  oDash.AllowDrag := True;
  AddKPI(oDash, 'tileRevenue', 'Revenue', '12,480 USD', '+4.2 %', 0, ktUp);
  AddKPI(oDash, 'tileOrders', 'Orders', '1,284', '+8.1 %', 4, ktUp);
  oDash.Theme := utDark;
  if FileExists('layout.json') then
    oDash.LoadLayoutFromFile('layout.json');
  oDash.SaveLayoutToFile('layout.json');
end;

Read the help topic →

The same dashboard in C++ Builder with the generated headers.

#include <vcl.h>
#include "sgcUICore_Theme.hpp"
#include "sgcDashboard_KPI.hpp"
#include "sgcDashboard_VCL.hpp"
#include "sgcDashboard_KPI_VCL.hpp"

void AddKPI(TsgcVCLDashboard *aDash, const String aName, const String aTitle,
  const String aValue, const String aChange, int aCol,
  TsgcDashboardKPITrend aTrend)
{
  TsgcVCLDashboardTile *oTile = new TsgcVCLDashboardTile(aDash->Owner);
  oTile->Name = aName;
  oTile->Parent = aDash;
  oTile->Col = aCol;
  oTile->ColSpan = 4;
  oTile->Title = aTitle;
  TsgcVCLKPICard *oCard = new TsgcVCLKPICard(aDash->Owner);
  oCard->Parent = oTile;
  oCard->Align = alClient;
  oCard->Value = aValue;
  oCard->Trend = aTrend;
  oCard->TrendValue = aChange;
  oCard->AddValue(47);
  oCard->AddValue(52);
}

void BuildDashboard(TWinControl *aOwner)
{
  TsgcVCLDashboard *oDash = new TsgcVCLDashboard(aOwner);
  oDash->Parent = aOwner;
  oDash->Align = alClient;
  // drag, resize and layout files need the Registered edition
  oDash->AllowDrag = true;
  AddKPI(oDash, "tileRevenue", "Revenue", "12,480 USD", "+4.2 %", 0, ktUp);
  AddKPI(oDash, "tileOrders", "Orders", "1,284", "+8.1 %", 4, ktUp);
  oDash->Theme = utDark;
  if (FileExists("layout.json"))
    oDash->LoadLayoutFromFile("layout.json");
  oDash->SaveLayoutToFile("layout.json");
}

Read the help topic →

The WinForms version in C#, with the same class names as Delphi.

using System.Windows.Forms;
using esegece.sgcDashboard;
using esegece.sgcUICore;

public static class KpiDashboard
{
    // One KPI tile with a sparkline, placed on the dashboard grid.
    static void AddKPI(TsgcWinFormsDashboard aDash, string aName, string aTitle,
        string aValue, string aChange, int aCol, TsgcDashboardKPITrend aTrend)
    {
        var oTile = new TsgcWinFormsDashboardTile();
        oTile.Name = aName;
        oTile.Title = aTitle;
        oTile.Col = aCol;
        oTile.ColSpan = 4;
        var oCard = new TsgcWinFormsKPICard();
        oCard.Dock = DockStyle.Fill;
        oCard.Value = aValue;
        oCard.Trend = aTrend;
        oCard.TrendValue = aChange;
        oCard.AddValue(47);
        oCard.AddValue(52);
        oTile.Controls.Add(oCard);
        aDash.Controls.Add(oTile);
    }

    public static void Build(Form aForm)
    {
        var oDash = new TsgcWinFormsDashboard();
        oDash.Dock = DockStyle.Fill;
        oDash.Theme = TsgcUITheme.utDark;
        oDash.AllowDrag = true; // drag and layout files: Registered edition
        AddKPI(oDash, "tileRevenue", "Revenue", "12,480 USD", "+4.2 %", 0, TsgcDashboardKPITrend.ktUp);
        AddKPI(oDash, "tileOrders", "Orders", "1,284", "+8.1 %", 4, TsgcDashboardKPITrend.ktUp);
        AddKPI(oDash, "tileChurn", "Churn", "2.4 %", "-0.3 %", 8, TsgcDashboardKPITrend.ktDown);
        aForm.Controls.Add(oDash);
        if (System.IO.File.Exists("layout.json"))
            oDash.LoadLayoutFromFile("layout.json");
        oDash.SaveLayoutToFile("layout.json");
    }
}
dotnet add package esegece.sgcDashboard.WinForms

Read the help topic →

Run the sgcDashboard Demos

Four demos for Delphi and C++ Builder and six for .NET, all in the compiled demos download.

Basic

Basic

Six tiles and four KPI cards on the 12 column grid, with a log and a list in the other tiles. The quickest way to see the layout engine and the theme switch.

Registered only LiveKPI

KPI cards fed by the sgcDashboardWS bridge, with values ticking and sparklines growing as messages arrive. Needs sgcWebSockets.

Registered only SaveLayout

Drag tiles by their header, resize them by the grip, save the layout to JSON, restart the demo and see it restored.

Suite

A chart, a map, a PDF viewer, a report preview and KPI cards from other sgcUI products in one themed dashboard.

.NET demos

Basic, BasicWpf, BasicAvalonia, LiveKPI, SaveLayout and Suite for WinForms, WPF and Avalonia.

Compiled demos

Ready to run executables of every sgcUI product, nothing to install.

Download sgcUI_bin.zip →

Where sgcDashboard Is Included

sgcDashboard is in sgcUI Professional and Enterprise, and it is also sold on its own. sgcDashboard is also included in the All-Access bundle.

sgcDashboard single package

€199 / developer, full source code, 1 year of updates.

Buy sgcDashboard → See pricing →

sgcUI Professional

Standard plus sgcDashboard, sgcCharts and sgcGauges, from €529.

See Professional →

sgcUI Enterprise

All 14 sgcUI products, from €699.

See Enterprise →

The free Community edition (esegece.sgcDashboard.Community on NuGet) includes the grid, tiles, KPI cards with sparklines, headless PNG and SVG and themes. It leaves out runtime drag and resize, SaveLayout and LoadLayout, and the sgcDashboardWS bridge.

FeatureCommunity (free)Registered
Tile grid with spans and auto-flow✓✓
KPI cards with trend and sparkline✓✓
Light and dark themes✓✓
Headless KPI cards as PNG and SVG✓✓
Runtime drag and resize of tiles−✓
SaveLayout and LoadLayout−✓
sgcDashboardWS live sources (WebSocket, MQTT, SSE)−✓

Supported Frameworks and Platforms

Components in sgcDashboard

ComponentWhat it is
TsgcVCLDashboard, TsgcFMXDashboardThe grid container for VCL and FireMonkey.
TsgcVCLDashboardTile, TsgcFMXDashboardTileA tile with a title that hosts any control.
TsgcVCLKPICard, TsgcFMXKPICardA KPI card with trend, footer and sparkline.
TsgcDashboardKPIThe framework neutral, headless KPI card with PNG and SVG export.
TsgcDashboardLayoutThe layout engine, also available on Linux64.
TsgcDashboardSource_WebSocket, _MQTT, _SSELive KPI sources of the sgcDashboardWS bridge (Registered only).
TargetComponentPlatforms
Delphi 7 to 13, VCLTsgcVCLDashboardWin32 and Win64
Delphi XE6 to 13, FireMonkeyTsgcFMXDashboardWindows, macOS, iOS and Android
C++ Builder 2007 to 13TsgcVCLDashboard, TsgcFMXDashboardGenerated .hpp headers and static libraries
Delphi 10.2 to 13, framework neutralTsgcDashboardLayout, TsgcDashboardKPILinux64, layout engine and headless KPI cards
.NET Framework 4.7.2, .NET 8, 9 and 10TsgcWinFormsDashboard, WPF and Avalonia counterpartsWinForms, WPF and Avalonia

Frequently Asked Questions

Yes, in the Registered edition. AllowDrag and AllowResize let users move tiles by the header and resize them by a grip, and SaveLayoutToFile or SaveLayout store the result as JSON. LoadLayout restores it by tile name, so layouts survive new versions of your application.

Any control. A tile is a container: set the control's parent to the tile and align it to the client area. The Suite demo hosts a chart, a map, a PDF viewer and a report preview, and sgcUI controls in a tile follow the dashboard theme.

From code, set Value and call AddValue, which is thread-safe. With the Registered edition and sgcWebSockets, the sgcDashboardWS sources read a number from each WebSocket, MQTT or SSE message by ValuePath and update the card and its trend for you.

The dashboards and tiles, the grid layout with auto-flow, KPI cards with sparklines, headless PNG and SVG and the themes. It leaves out runtime drag and resize, SaveLayout and LoadLayout, and the sgcDashboardWS bridge. See Editions.

Yes. TsgcFMXDashboard, its tiles and the KPI cards run on FireMonkey from Delphi XE6 on Windows, macOS, iOS and Android, with the same layout engine as the VCL dashboard. Sizes are device independent and follow the form scale.

Yes. TsgcDashboardKPI draws a card with no window and no VCL or FireMonkey, and writes PNG or SVG to a file or stream. It builds on every platform, Linux64 included, so a service or web server can produce the images.

Yes. All sizes are device independent pixels. The VCL dashboard scales them by the monitor PPI divided by 96 and the FireMonkey dashboard by the form scale, so tiles, gaps and row heights keep their proportions on any monitor.

sgcDashboard Help

3,000+Developers
20+Years
761+Components
30+API Integrations
5Platforms
30-Day Money-Back GuaranteeNot satisfied? Request a full refund within 30 days of purchase. See refund policy

Try sgcDashboard Today

The sgcUI trial includes sgcDashboard and every other sgcUI product.