Delphi, C++ Builder & .NET Part of sgcUI

sgcDiagram, the Flowchart and Diagram Editor for Delphi, C++ Builder & .NET

Give your users a real diagram editor inside your own application. They drag shapes from a palette, connect them, type text in place and undo anything. You arrange the whole diagram with one call, save it as JSON and export it to PNG or SVG, even on a server with no window.

VCL, FireMonkey, WinForms, WPF, Avalonia14 shapes and 3 connector kindsHeadless PNG and SVG, Linux64 includedIncluded in sgcUI Enterprise
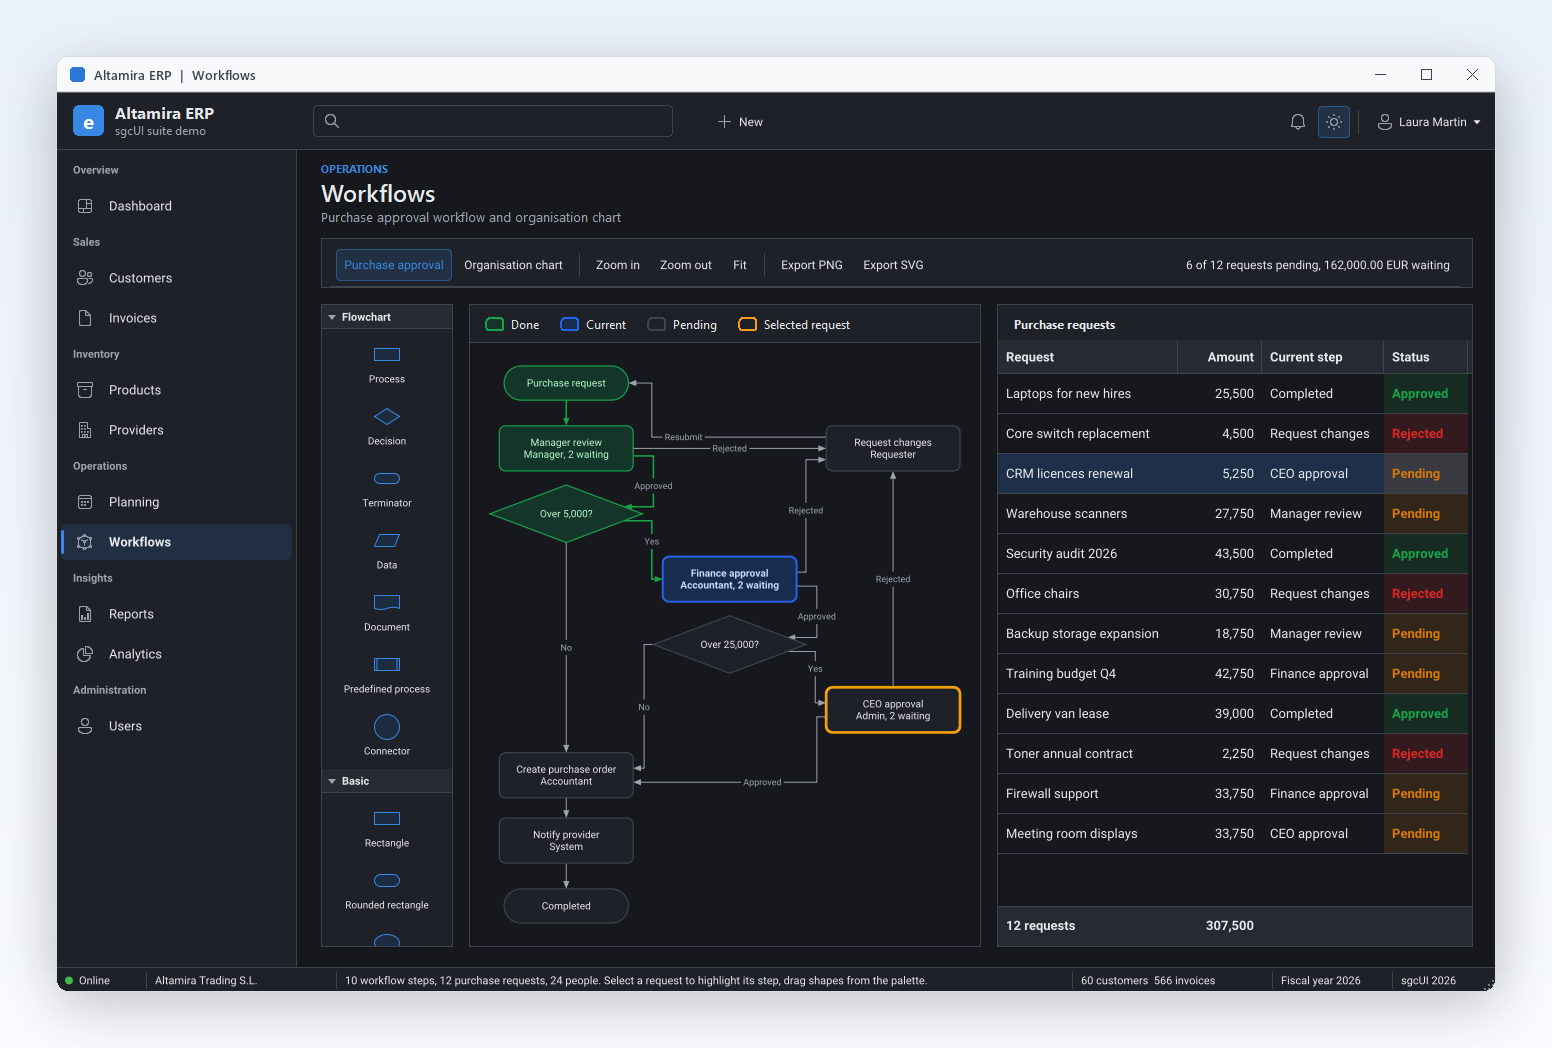
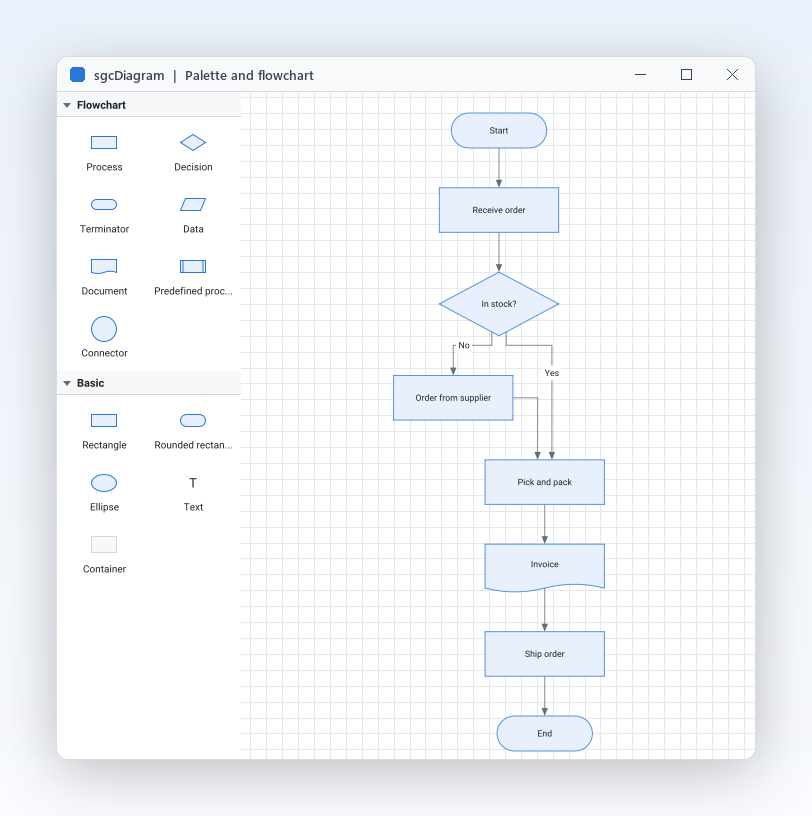
FlowchartEditor demo: the shape palette with flowchart and basic shapes next to an order flowchart

Everything a Diagram Editor Needs

Thirteen features that put a real diagram editor in your application.

An editor your users can use

Everything a user expects from a diagram tool, as two components you drop on a form.

An editor your users can use

Let users draw their own diagrams

Business applications often need a diagram the user owns: an approval flow, a process map, the plan of a production line. Instead of sending users to a separate drawing tool, put the editor inside your own form. Drop a TsgcVCLDiagramPalette and a TsgcVCLDiagramView, link them with the View property of the palette, and your users drag shapes onto the canvas, draw connectors from the ports and type the text of a node in place. The same pair exists for FireMonkey, WinForms, WPF and Avalonia.

  • TsgcVCLDiagramPalette drops shapes with a drag, or with a click on the item and a click on the view
  • A double click, F2 or simply typing edits the text of a node in place
  • Tool switches between dgtSelect, dgtPan, dgtConnector and dgtShape
  • Select with Shift, Ctrl or a rubber band, then move, resize, rotate, group, copy and paste
  • Right to left for Arabic and Hebrew: the palette, rulers, minimap and toolbars are mirrored while the canvas keeps your geometry, and the dglRightToLeft direction of the automatic layouts arranges a diagram from the right
Read the help topic
14 shapes for flowcharts, org charts and sketches

An editor your users can use

14 shapes for flowcharts, org charts and sketches

Most diagrams in business software use a small, familiar vocabulary, and sgcDiagram ships it ready. You get the flowchart symbols process, decision, terminator, data, document, predefined process and connector circle, the basic rectangle, rounded rectangle and ellipse, free text, images, containers that hold other nodes, and custom outlines from SVG path data. Each shape knows its outline, its text area, its default ports and its theme colours, so a decision gets its ports on the corners without any code. Place a node with Left, Top, Width and Height, and rotate it with Angle.

  • Shape takes a TsgcDiagramShape value such as dgsDecision
  • dgsPath draws any outline from PathData in SVG path syntax
  • dgsContainer holds child nodes through ContainerId and moves them along
  • TextAlign and TextVAlign place the wrapped text inside the shape
Read the help topic
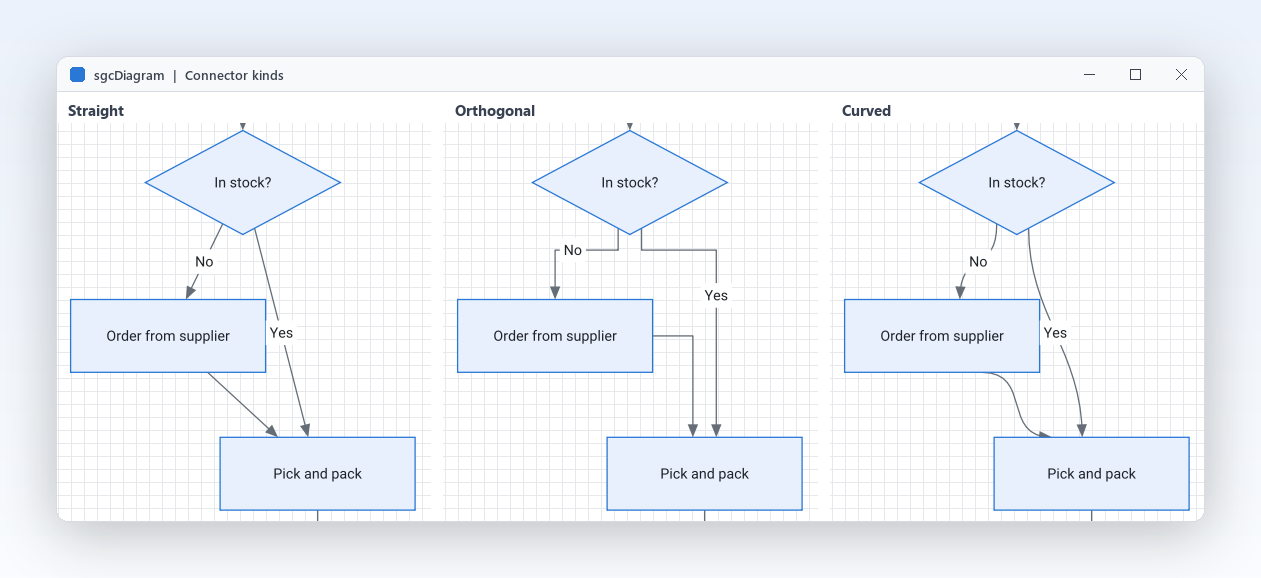
Straight, orthogonal and curved connectors

An editor your users can use

Straight, orthogonal and curved connectors

A diagram is only as readable as its lines. Each connector picks its kind: straight lines or polylines through waypoints, orthogonal routes of horizontal and vertical segments, or smooth curves for node graphs. AddConnector creates a connector of the DefaultConnectorKind of the document. Arrow heads at both ends, dashed or dotted strokes and any number of labels, placed along the line and draggable by the user, turn a plain line into a clear Yes or No branch. In the Registered edition the orthogonal router steers around the nodes and spreads parallel segments apart.

  • Kind is dgcStraight, dgcOrthogonal or dgcCurved
  • StartArrow and EndArrow take a TsgcDiagramArrow such as dgaTriangle or dgaDiamond
  • Labels holds any number of labels, placed with Position and Offset
  • Waypoints bend straight and curved connectors where you want them

Community routes orthogonal connectors as simple elbows that do not avoid the nodes.

Read the help topic

An editor your users can use

Nothing frustrates a user more than a diagram that falls apart when a box moves. Every connector end is glued: to a named port, to the outline of the node, or left free at a point. Move, resize or rotate a node and its connectors follow and are routed again. Shapes come with ports at the midpoints of their sides, and you can add your own with a position, a side, a direction of flow and a caption, which is how the typed inputs and outputs of a node editor are built. ShowPorts decides whether the ports appear always, on hover or never.

  • TsgcDiagramPort has Id, X, Y, Side, Flow and Caption
  • Flow makes a port an input with dgfIn or an output with dgfOut
  • SourcePortId and TargetPortId glue a connector end to a port
  • ShowPorts is dgvHover by default, or dgvAlways and dgvNever
Read the help topic

Diagrams that build themselves

Let the code do the tidy work: arrange a graph, build a chart from a table, or wire blocks with rules.

Diagrams that build themselves Registered only

Arrange the whole diagram in one call

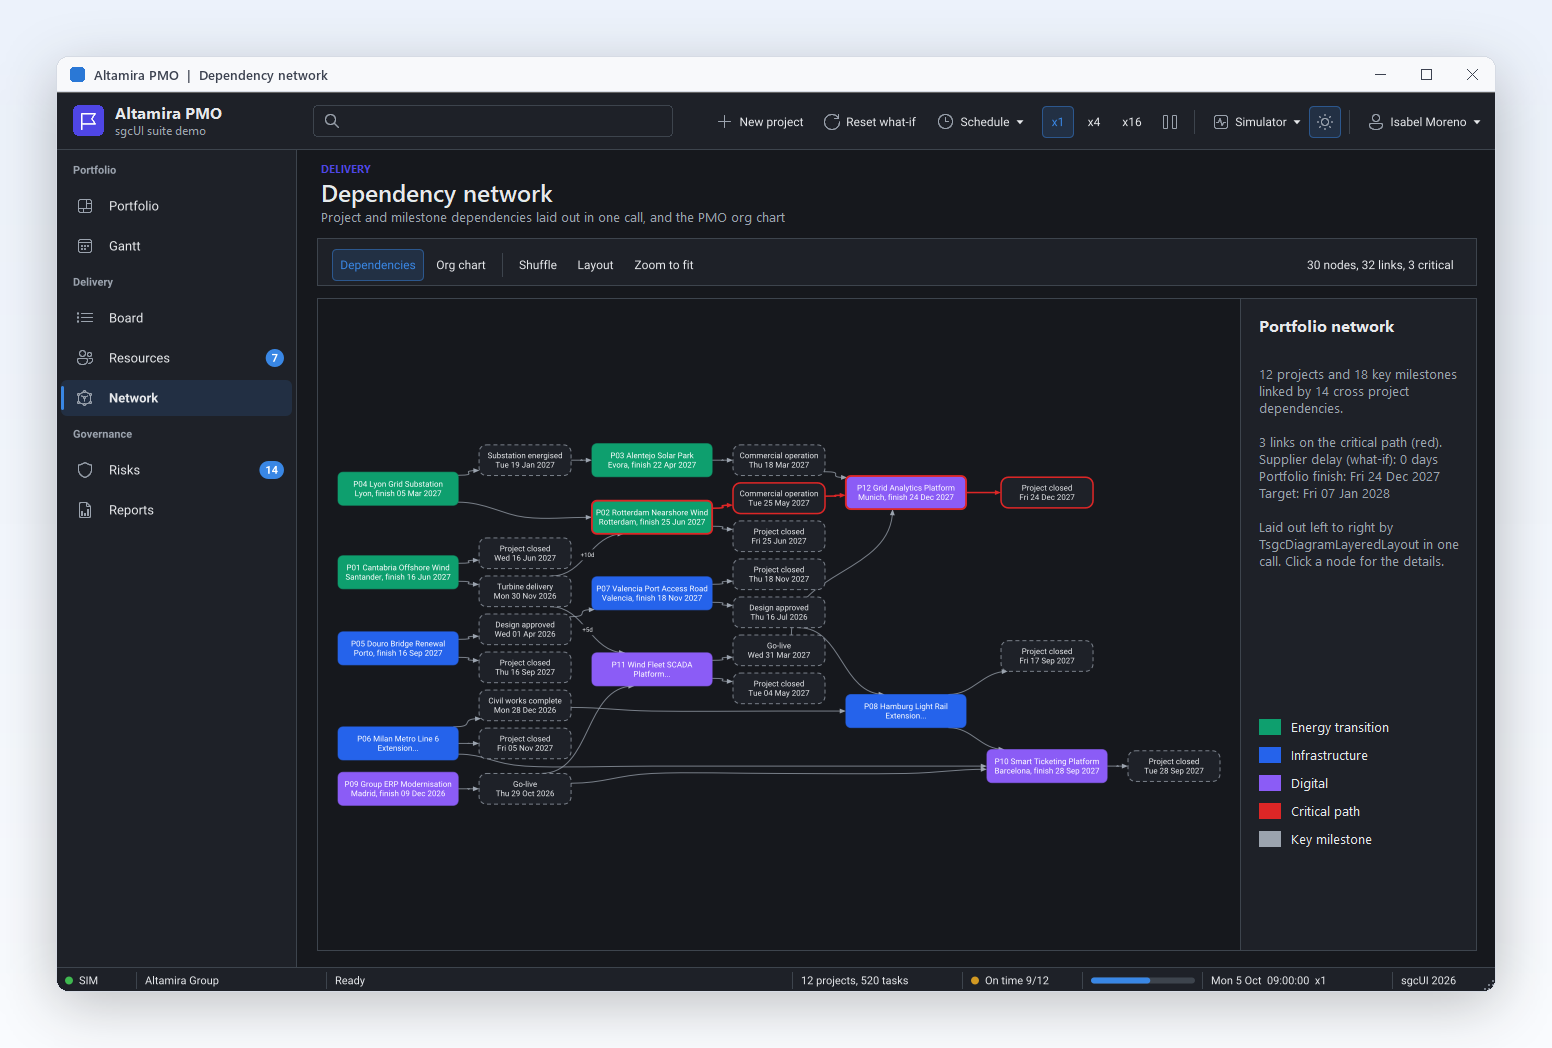
Diagrams built from code, or drawn quickly by a user, rarely look tidy. TsgcDiagramLayeredLayout arranges a directed graph in layers, the Sugiyama method, so flowcharts, process maps, state machines and dependency graphs come out left to right or top to bottom with few connector crossings and long connectors kept straight. TsgcDiagramTreeLayout centres parents over their children for org charts and category trees. Both run as one undo step, so a user can try a layout and take it back with Ctrl+Z. SelectionOnly arranges just the selected part.

  • Direction is dglTopToBottom, dglLeftToRight, dglBottomToTop or dglRightToLeft
  • LayerSpacing and NodeSpacing set the gaps, 60 and 30 world units by default
  • Crossings reports the connector crossings after Execute
  • TreeStyle set to dgoCompactLeaves stacks the staff of a manager in one column

In Community the nodes stay where the user or the code puts them.

Read the help topic
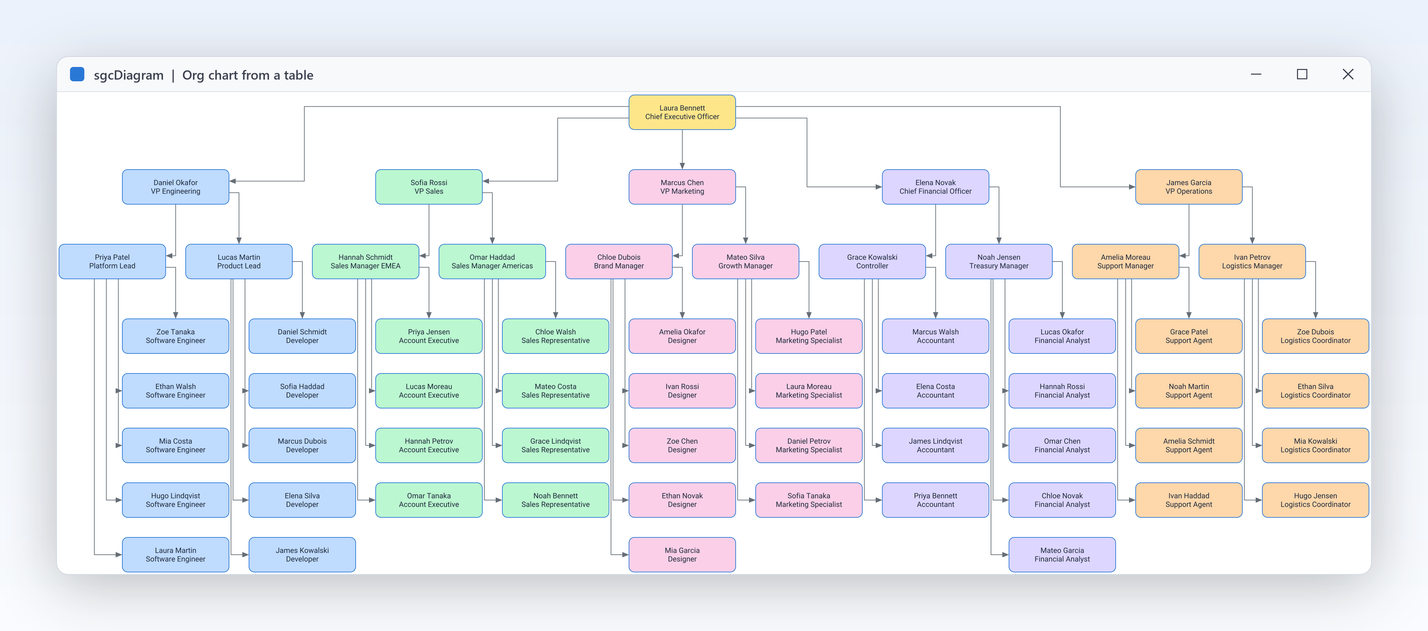
Org charts straight from a table

Diagrams that build themselves Registered only

Org charts straight from a table

Your employees, cost centres or product categories already live in a table with a key and a parent column. TsgcDiagramDataBinding turns those rows into a diagram: every row becomes a node, every parent key a connector, and the tree or layered layout arranges the result. Set DataSource, KeyField, ParentField and LabelField, point Target at the view and set Active. With LiveUpdates on, a posted edit, an insert or a delete rebuilds the chart on the next turn of the message loop, while moving through the rows leaves the selection alone.

  • DataSource, KeyField, ParentField and LabelField map the columns
  • OnCreateNode styles each node from any field of its row
  • dgbAuto picks the tree layout for a tree and the layered layout for several parents
  • ParentSeparator lists several parents in one field

Community has no data binding: build the nodes in code with AddNode and AddConnector.

Read the help topic
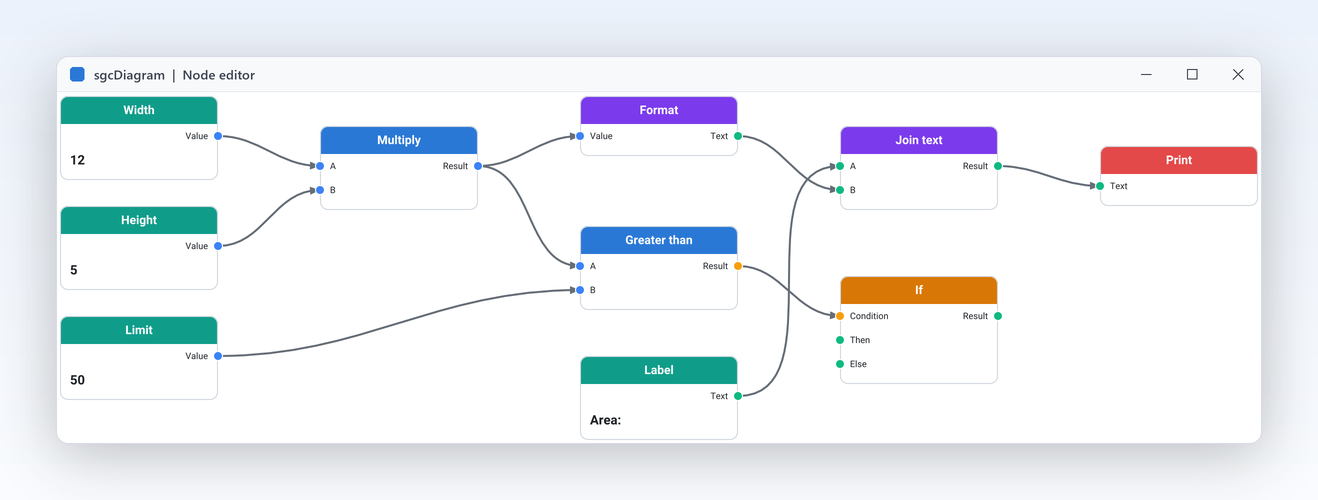
Node editors for workflows and pipelines

Diagrams that build themselves

Node editors for workflows and pipelines

Automation rules, data pipelines and IoT flows are easiest to understand as blocks wired together. Give each node typed input ports on the left and output ports on the right, switch DefaultConnectorKind to curved connectors, and paint the blocks yourself in OnDrawNode with a title band and coloured port dots. OnConnecting lets you refuse a link before it is made, so a number output never feeds a text input. The NodeEditor demo builds exactly this, with blocks added in one undo step and graphs saved as JSON together with their ports and captions.

  • OnConnecting vetoes a connection, for example between ports of different types
  • OnDrawNode paints a node, or adds to the default drawing
  • DefaultConnectorKind set to dgcCurved gives the classic node graph look
  • The Caption of a port is drawn next to it inside the node
Read the help topic

Undo, files and export

Safe editing for the user, and a document format and image output your application can rely on.

Undo everything, snap to guides

Undo, files and export

Undo everything, snap to guides

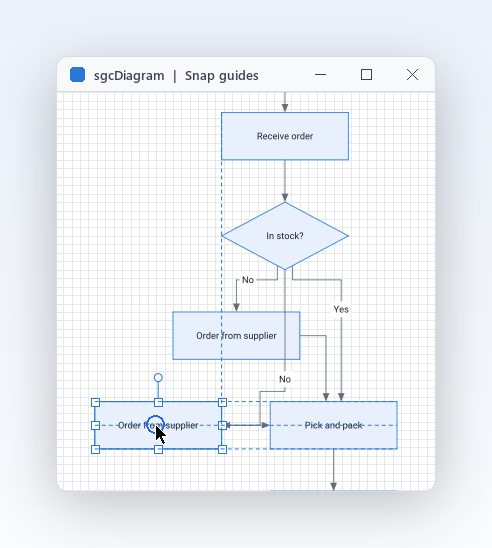
Users experiment when they know they can go back. The document keeps an undo and a redo stack, and every user action in the view is one step. In code, BeginTransaction and EndTransaction group any number of changes into a single named step, and Rollback discards them. Copy and paste work inside the application, and repeated pastes are offset so they do not stack. While a node moves or resizes, its edges and centre lines snap to the grid and to the nodes around it, and a guide line shows the alignment.

  • BeginTransaction, EndTransaction and Rollback group changes made in code
  • UndoLimit keeps 100 steps by default, and UndoCaption names the next undo
  • CopyToClipboard, CutToClipboard and PasteFromClipboard on the view
  • SnapToGrid, SnapToGuides and GridSize control the alignment aids
Read the help topic
Save as JSON, open it anywhere

Undo, files and export

Save as JSON, open it anywhere

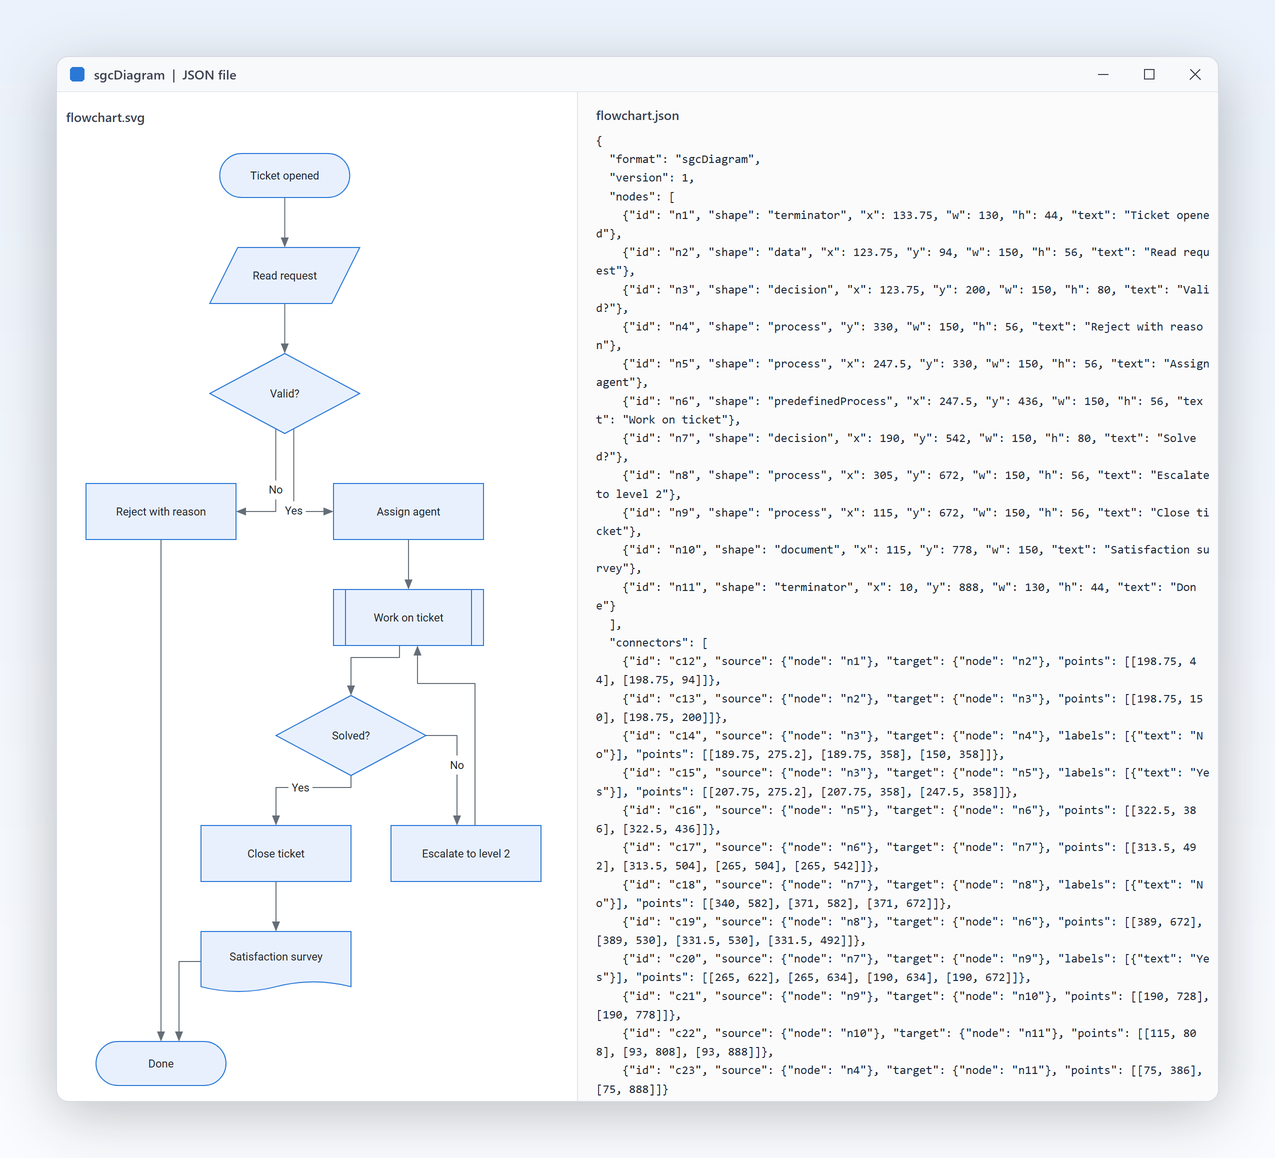
A diagram is data your application stores, sends and versions. The document saves to JSON as a string, a file or a stream, and the format is identical on every platform and in every edition: a file saved by a Delphi desktop application opens in a C++ Builder tool, a .NET service or a Community build. The output is canonical, with a fixed key order and default values left out, so the same diagram always gives the same text and compares cleanly in source control. Images travel inside the file as PNG data.

  • SaveToFile and LoadFromFile, SaveToStream and LoadFromStream
  • SaveToJSON and LoadFromJSON for a database field or a web request
  • A view streams its diagram in the form file as DiagramJSON
  • The connector routes stored in the file are kept when it loads
Read the help topic
Export PNG and SVG, even on a server

Undo, files and export

Export PNG and SVG, even on a server

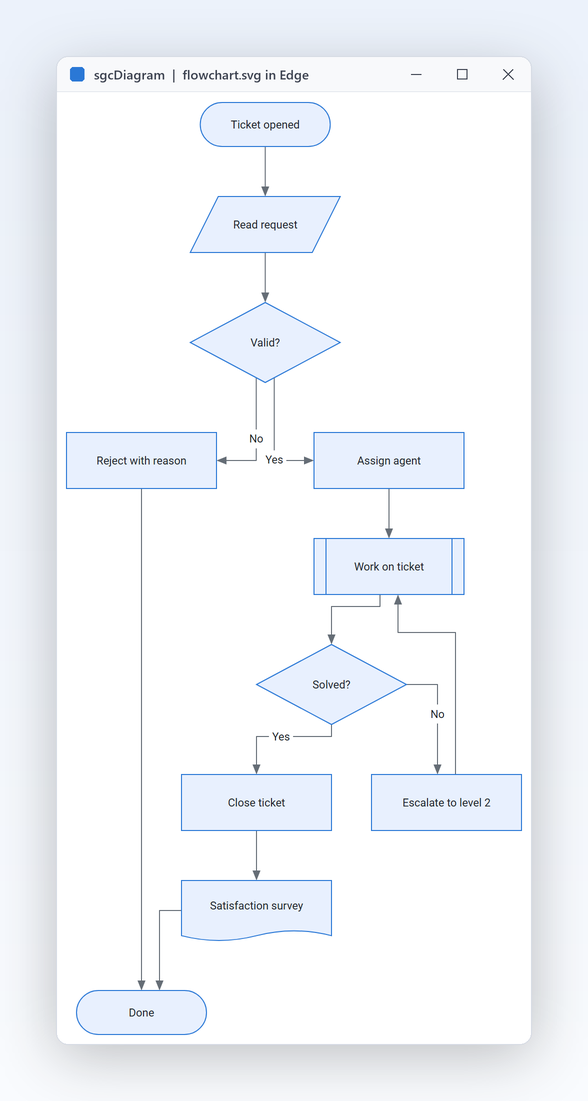
Diagrams end up in reports, e-mails, wiki pages and slides. The view saves what it shows as PNG or SVG, with a scale factor for sharp images and with its custom drawing and theme applied, so a dark diagram exports dark. TsgcDiagramRenderer does the same with no view at all: a console program, a Windows service or a Linux64 daemon builds a diagram, lays it out and writes the files. The Headless demo does exactly that with a support ticket flowchart, and built with Delphi 13 it writes the same bytes on Win32, Win64 and Linux64.

  • SaveToPNG and SaveToSVG on the view, with a pixels per world unit scale
  • SaveToPNGFile and SaveToSVGFile on TsgcDiagramRenderer, no window needed
  • RenderTo paints part of a document on any sgcUICore canvas
  • PDF export and printing are not part of version 1
Read the help topic

Viewing and styling

Show diagrams to people who should not edit them, in the look of your application.

A read only viewer for dashboards and portals

Viewing and styling

A read only viewer for dashboards and portals

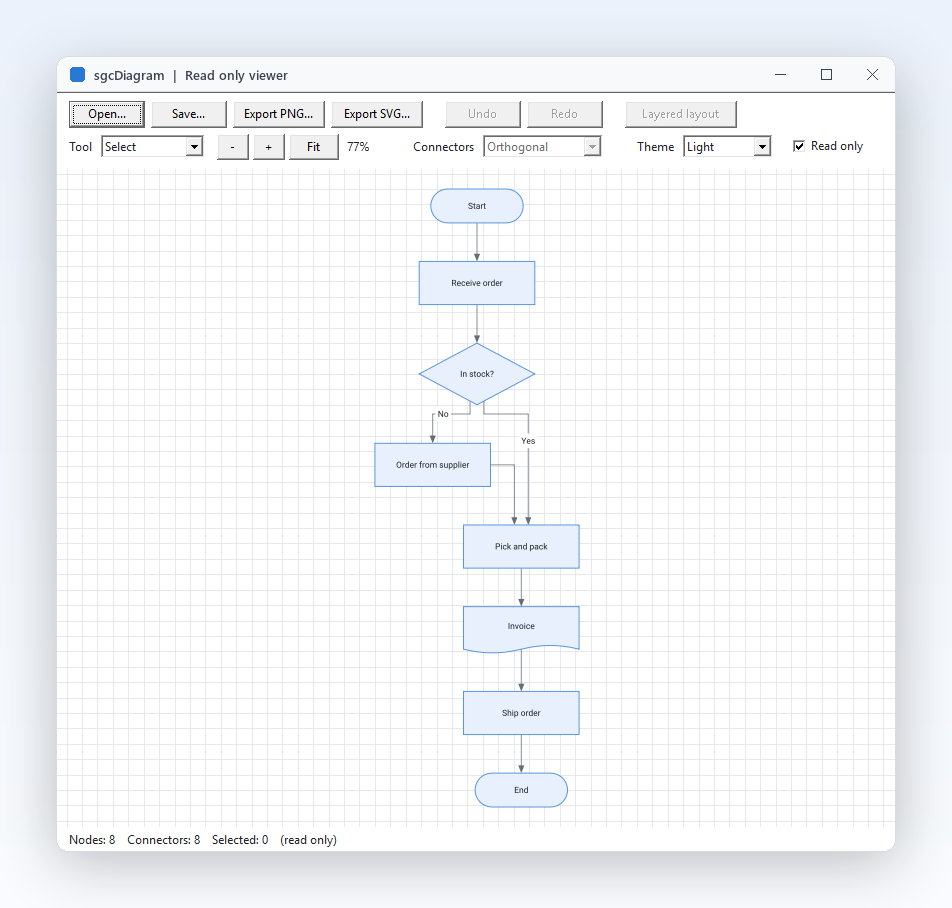
Not every user should edit the process map. Set ReadOnly and the same view becomes a viewer: users select, zoom with Ctrl and the wheel and pan with the middle button or Space, but nothing moves, connects or gets deleted, and the palette cannot drop shapes. The pointer turns into a hand over an item and OnItemClick reports which one, so a click on a node can open the matching record. ZoomToFit frames the whole diagram from code. To protect only part of a diagram, lock single items or whole layers instead.

  • ReadOnly keeps selection, zoom and pan, and blocks every edit
  • OnItemClick, OnItemDblClick and OnHover report the item under the pointer
  • ZoomToFit, ZoomToSelection and CenterOn move the view from code
  • Locked protects single items or a whole layer
Read the help topic

Viewing and styling

Light, dark and your own drawing

A diagram should look like part of your application, not a pasted picture. The views, the palettes and the export use the sgcUICore themes, so one Theme property switches between light and dark and matches the sgcUI grids, charts and dashboards on the same form. Each node and connector has its own Style with fill, stroke, dash, corner radius and text settings, and NodeStyle and ConnectorStyle are the templates for new items. For full control, OnDrawNode lets you paint a node yourself, and FontFile draws the text with a TrueType font of your choice.

  • Theme takes utDefault (follow the application theme), utLight, utDark or utCustom
  • Style sets Fill, Stroke, StrokeWidth, Dash and CornerRadius
  • NodeStyle and ConnectorStyle style every new item
  • sgcUIARGB builds colours such as a corporate teal
Read the help topic

Accessibility

UI Automation for screen readers, the keyboard and high contrast, with no setup.

Accessibility

Draw diagrams with the keyboard and expose them to UI Automation

sgcDiagram exposes the nodes with their text, the links between them and the shape palette to Microsoft UI Automation, and the diagram describes itself with the same text alternative it writes into an accessible PDF.

  • Arrows move the selection, Alt+Arrows nudge it by one pixel and Alt+Shift+Arrows resize the selected node
  • Ctrl+K starts a link from the selected node: Tab and Shift+Tab choose the target, Enter connects and Esc cancels
  • In the palette, the arrows, Home and End move between shapes, and Enter or Space adds the focused shape
  • Ctrl+Tab and Ctrl+Shift+Tab move the focus to the next or previous control, and under a Windows high contrast theme the diagram paints with the system colours

Accessibility is on by default in every edition, the free Community edition included, on VCL in every Delphi and C++Builder version from Delphi 7 to Delphi 13, on FireMonkey on Windows, and on WinForms, WPF and Avalonia. In Delphi and C++Builder, AccessibleName and AccessibleDescription set the name and the description exposed to UI Automation, and in .NET the standard accessible name and help text of each framework do the same. See the accessibility conformance reports. Connector bend points are edited with the mouse only.

Read the help topic

See sgcDiagram in action

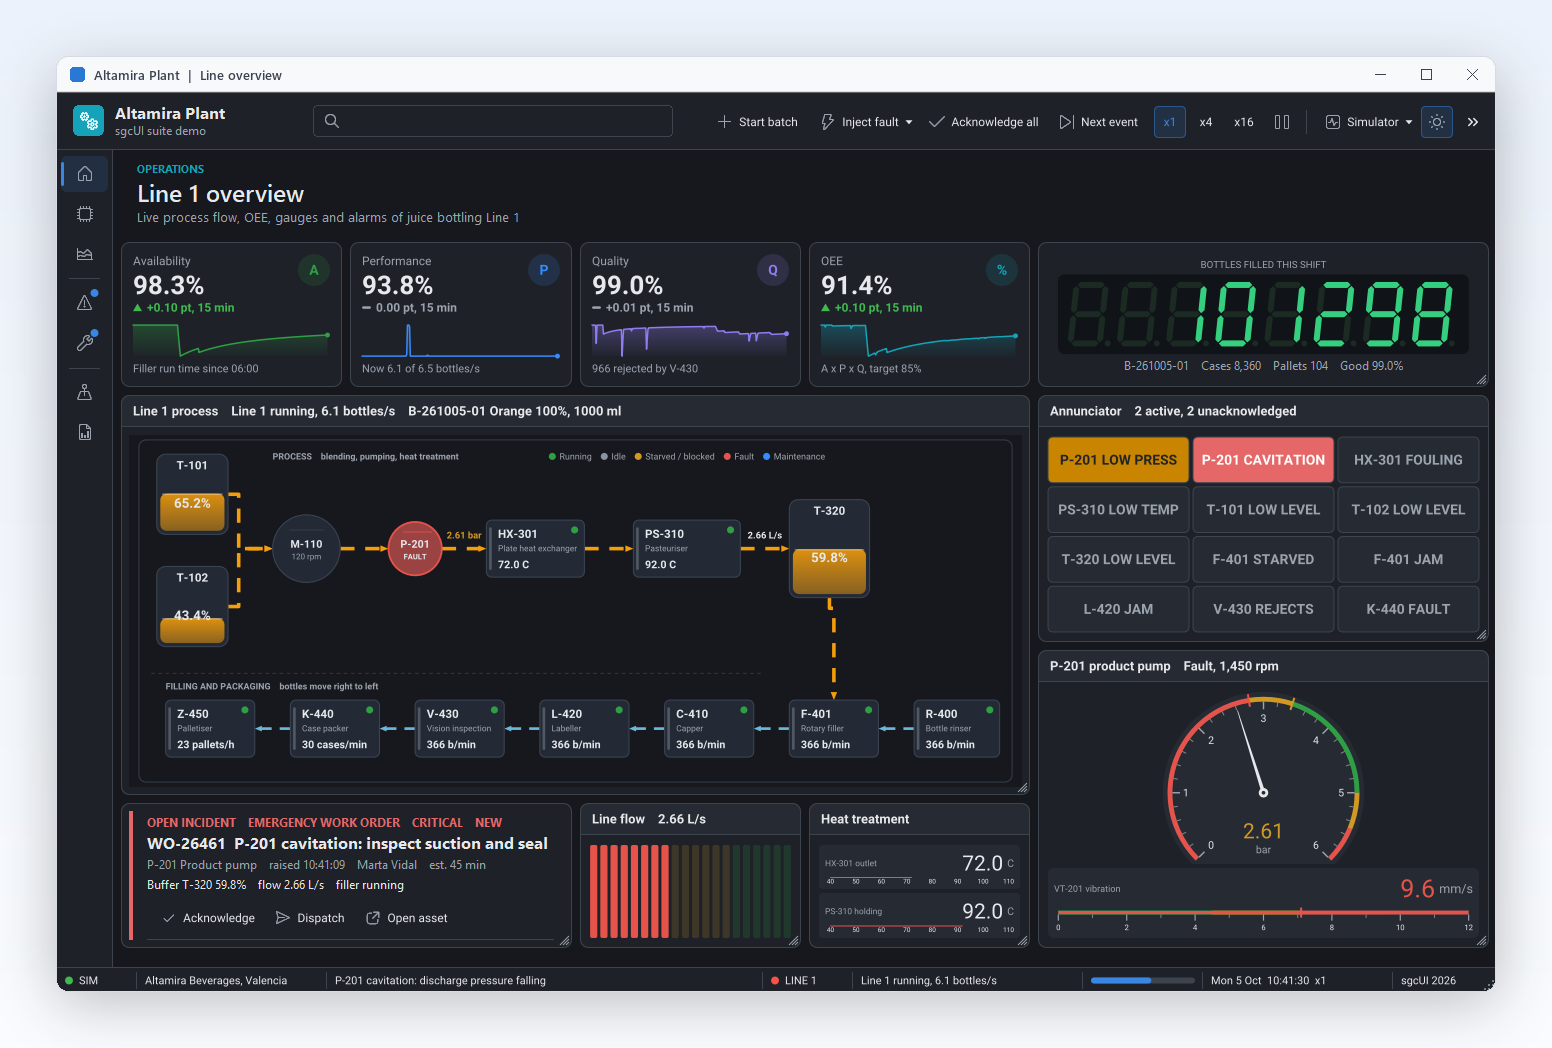
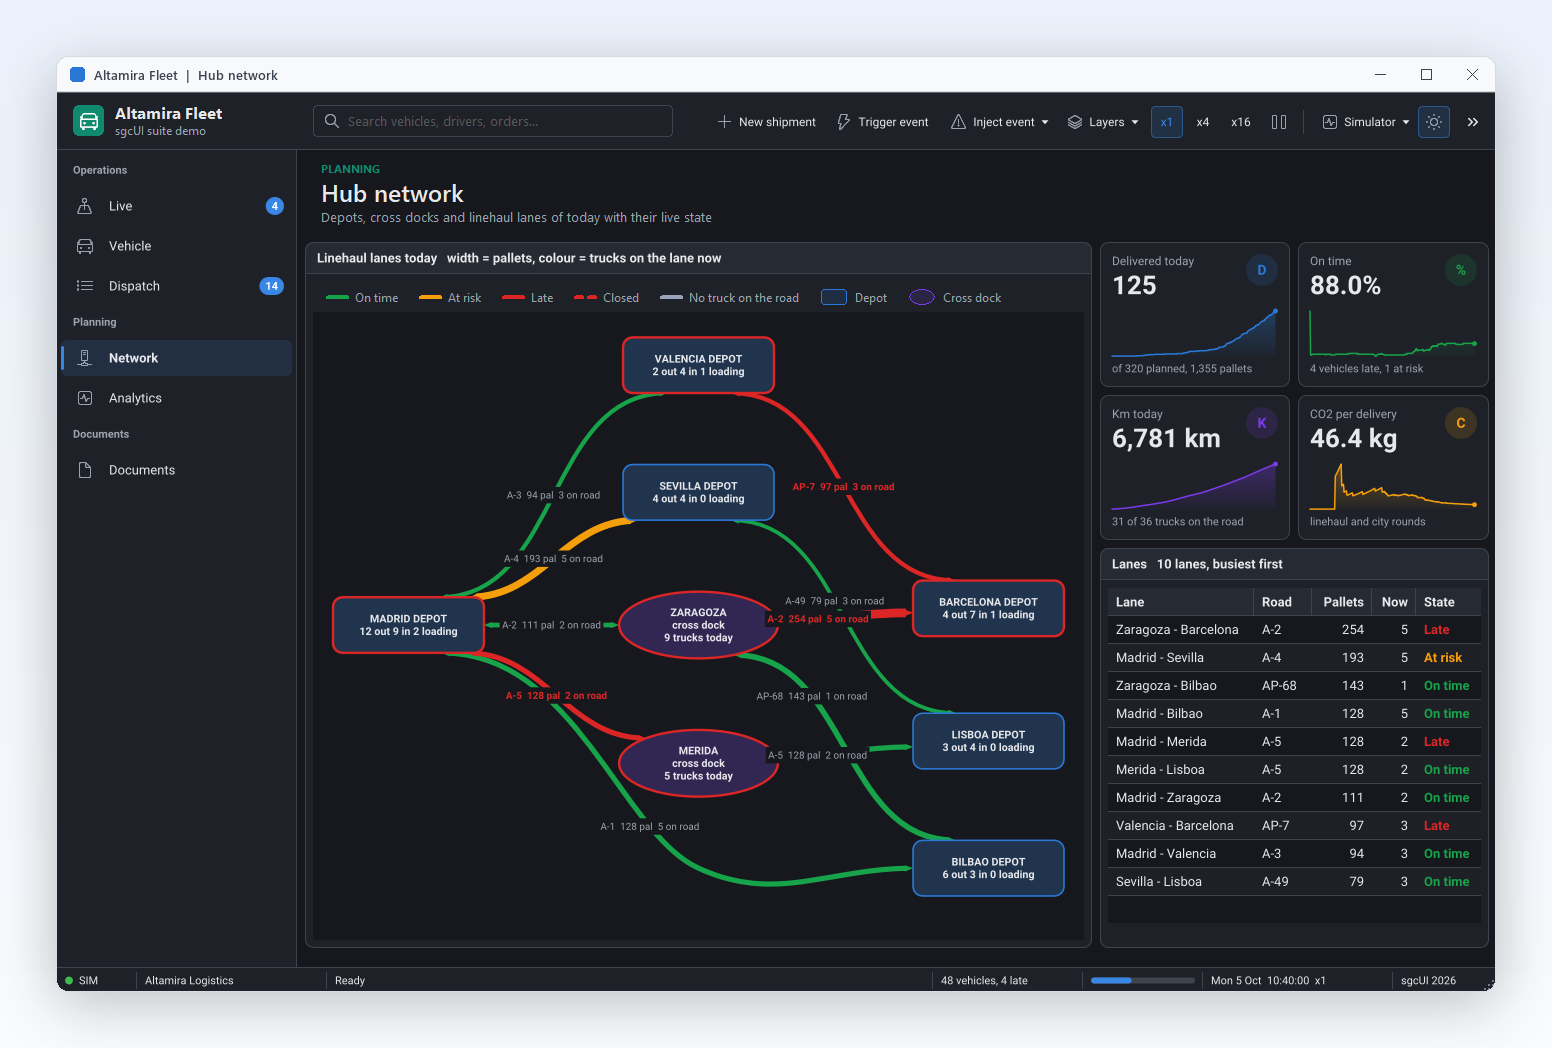
sgcDiagram inside the sgcUI suite demos: complete applications that run offline with built-in simulated data.

Who Builds with sgcDiagram

Workflow and approval designers

Purchase approvals, ticket escalations and onboarding checklists change often, and the people who own them are not programmers. Embed the editor so a process owner draws the flow with decisions and Yes or No labels, saves it as JSON in your database, and your application reads the same document to drive the real process. ReadOnly turns the stored flow into a map for everyone else. Start from FlowchartEditor.

  • Palette and in place editing
  • Connector labels
  • JSON files
Run the FlowchartEditor demo

Org charts from HR data

HR and ERP systems already know who reports to whom. Bind the employees table with TsgcDiagramDataBinding, let the tree layout with compact leaves arrange managers and staff, and colour each box by department in OnCreateNode. When HR posts a change in the grid, the chart rebuilds on its own, and a click on a node selects the employee. The OrgChart demo binds 60 employees this way.

  • Data binding
  • Tree layout
  • Viewer mode
Run the OrgChart demo

Node editors for pipelines and automation

Products that let customers build data pipelines, automation rules or IoT flows need a canvas where blocks are wired together. Typed ports, curved connectors and OnConnecting give you the rules, OnDrawNode gives the blocks your own look, and the graph is saved as JSON that your engine can execute. Because the document has no user interface dependency, a server can load and check the same graph.

  • Typed ports
  • Connection rules
  • Custom drawing
Run the NodeEditor demo

An Order Flow in a Few Lines

The same API in Delphi, C++ Builder and C#: add a palette and a view, create shapes and connectors in one undo step, then arrange them. The layout call needs the Registered or Trial edition.

uses
  Classes, SysUtils, Forms, Controls,
  sgcUICore_Theme, sgcDiagram_Types, sgcDiagram_Model, sgcDiagram_Layout,
  sgcDiagram_VCL;

type
  TFormOrders = class(TForm)
  private
    FPalette: TsgcVCLDiagramPalette;
    FView: TsgcVCLDiagramView;
    procedure DoSelectionChange(Sender: TObject);
  public
    constructor CreateNew(aOwner: TComponent; Dummy: Integer = 0); override;
    procedure BuildFlow;
  end;

constructor TFormOrders.CreateNew(aOwner: TComponent; Dummy: Integer);
begin
  inherited;
  FPalette := TsgcVCLDiagramPalette.Create(Self);
  FPalette.Parent := Self;
  FPalette.Align := alLeft;
  FView := TsgcVCLDiagramView.Create(Self);
  FView.Parent := Self;
  FView.Align := alClient;
  FView.ShowPorts := dgvHover;
  FView.Theme := utDark;
  FView.OnSelectionChange := DoSelectionChange;
  FPalette.View := FView;
end;

procedure TFormOrders.DoSelectionChange(Sender: TObject);
begin
  Caption := Format('Orders, %d selected', [FView.Diagram.Selection.Count]);
end;

procedure TFormOrders.BuildFlow;
var
  oDoc: TsgcDiagramDocument;
  oStart, oStock, oPay, oShip: TsgcDiagramNode;
  oLayout: TsgcDiagramLayeredLayout;
begin
  oDoc := FView.Diagram;
  oDoc.BeginTransaction('Order flow');
  try
    oStart := oDoc.AddNode(dgsTerminator, 0, 0, 140, 50, 'Order received');
    oStock := oDoc.AddNode(dgsDecision, 0, 0, 160, 90, 'In stock?');
    oPay := oDoc.AddNode(dgsProcess, 0, 0, 140, 60, 'Charge card');
    oShip := oDoc.AddNode(dgsPredefinedProcess, 0, 0, 140, 60, 'Ship order');
    oPay.Style.Fill := sgcUIARGB($FF, $00, $96, $88);
    oDoc.AddConnector(oStart, oStock);
    oDoc.AddConnector(oStock, oPay).Labels.Add.Text := 'Yes';
    oDoc.AddConnector(oPay, oShip);
    oDoc.AddConnector(oStock, oDoc.AddNode(dgsDocument, 0, 0, 140, 60,
      'Backorder note')).Labels.Add.Text := 'No';
  finally
    oDoc.EndTransaction;
  end;
  // arrange left to right, one undo step
  oLayout := TsgcDiagramLayeredLayout.Create(oDoc);
  try
    oLayout.Direction := dglLeftToRight;
    oLayout.Execute;
  finally
    oLayout.Free;
  end;
  FView.ZoomToFit;
  FView.SaveToPNG(ExtractFilePath(ParamStr(0)) + 'orders.png', 2);
end;
#include <vcl.h>
#include "sgcUICore_Theme.hpp"
#include "sgcDiagram_Types.hpp"
#include "sgcDiagram_Model.hpp"
#include "sgcDiagram_Layout.hpp"
#include "sgcDiagram_VCL.hpp"

void BuildOrderFlow(TForm *Form)
{
  TsgcVCLDiagramPalette *Palette = new TsgcVCLDiagramPalette(Form);
  Palette->Parent = Form;
  Palette->Align = alLeft;
  TsgcVCLDiagramView *View = new TsgcVCLDiagramView(Form);
  View->Parent = Form;
  View->Align = alClient;
  View->ShowPorts = dgvHover;
  View->Theme = utDark;
  Palette->View = View;

  TsgcDiagramDocument *Doc = View->Diagram;
  Doc->BeginTransaction("Order flow");
  try
  {
    TsgcDiagramNode *Start = Doc->AddNode(dgsTerminator, 0, 0, 140, 50, "Order received");
    TsgcDiagramNode *Stock = Doc->AddNode(dgsDecision, 0, 0, 160, 90, "In stock?");
    TsgcDiagramNode *Pay = Doc->AddNode(dgsProcess, 0, 0, 140, 60, "Charge card");
    TsgcDiagramNode *Ship = Doc->AddNode(dgsPredefinedProcess, 0, 0, 140, 60, "Ship order");
    TsgcDiagramNode *Note = Doc->AddNode(dgsDocument, 0, 0, 140, 60, "Backorder note");
    Pay->Style->Fill = sgcUIARGB(0xFF, 0x00, 0x96, 0x88);
    Doc->AddConnector(Start, Stock, "", "");
    Doc->AddConnector(Stock, Pay, "", "")->Labels->Add()->Text = "Yes";
    Doc->AddConnector(Pay, Ship, "", "");
    Doc->AddConnector(Stock, Note, "", "")->Labels->Add()->Text = "No";
  }
  __finally
  {
    Doc->EndTransaction();
  }
  // arrange left to right, one undo step
  TsgcDiagramLayeredLayout *Layout = new TsgcDiagramLayeredLayout(Doc);
  try
  {
    Layout->Direction = dglLeftToRight;
    Layout->Execute();
  }
  __finally
  {
    delete Layout;
  }
  View->ZoomToFit();
  View->SaveToPNG(ExtractFilePath(ParamStr(0)) + "orders.png", 2);
}
using System;
using System.IO;
using System.Windows.Forms;
using esegece.sgcDiagram;
using esegece.sgcUICore;

public class OrdersForm : Form
{
    readonly TsgcWinFormsDiagramView View;

    public OrdersForm()
    {
        View = new TsgcWinFormsDiagramView { Dock = DockStyle.Fill };
        View.ShowPorts = TsgcDiagramShowPorts.dgvHover;
        View.Theme = TsgcUITheme.utDark;
        View.OnSelectionChange += Sender =>
            Text = "Orders, " + View.Diagram.Selection.Count + " selected";
        Controls.Add(View);
        Controls.Add(new TsgcWinFormsDiagramPalette { Dock = DockStyle.Left, View = View });
        BuildFlow();
    }

    void BuildFlow()
    {
        TsgcDiagramDocument oDoc = View.Diagram;
        oDoc.BeginTransaction("Order flow");
        try
        {
            TsgcDiagramNode oStart = oDoc.AddNode(TsgcDiagramShape.dgsTerminator, 0, 0, 140, 50, "Order received");
            TsgcDiagramNode oStock = oDoc.AddNode(TsgcDiagramShape.dgsDecision, 0, 0, 160, 90, "In stock?");
            TsgcDiagramNode oPay = oDoc.AddNode(TsgcDiagramShape.dgsProcess, 0, 0, 140, 60, "Charge card");
            TsgcDiagramNode oShip = oDoc.AddNode(TsgcDiagramShape.dgsPredefinedProcess, 0, 0, 140, 60, "Ship order");
            TsgcDiagramNode oNote = oDoc.AddNode(TsgcDiagramShape.dgsDocument, 0, 0, 140, 60, "Backorder note");
            oPay.Style.Fill = sgcUICore_Theme.sgcUIARGB(0xFF, 0x00, 0x96, 0x88);
            oDoc.AddConnector(oStart, oStock);
            oDoc.AddConnector(oStock, oPay).Labels.Add().Text = "Yes";
            oDoc.AddConnector(oPay, oShip);
            oDoc.AddConnector(oStock, oNote).Labels.Add().Text = "No";
        }
        finally
        {
            oDoc.EndTransaction();
        }
        // arrange left to right, one undo step
        TsgcDiagramLayeredLayout oLayout = new TsgcDiagramLayeredLayout(oDoc);
        oLayout.Direction = TsgcDiagramDirection.dglLeftToRight;
        oLayout.Execute();
        View.ZoomToFit();
        View.SaveToPNG(Path.Combine(AppContext.BaseDirectory, "orders.png"), 2);
    }
}
dotnet add package esegece.sgcDiagram.WinForms

Run the sgcDiagram Demos

Every demo ships for Delphi and for C++ Builder with the same name. The .NET edition has FlowchartEditor (WinForms), FlowchartWpf, FlowchartAvalonia, NodeEditor, OrgChart and ConsoleRender.

FlowchartEditor

Registered only FlowchartEditor

An order flow built in code: drag shapes, draw connectors from the ports, switch the connector kind, undo, run the layered layout, open and save JSON, export PNG and SVG, switch theme and read only mode.

OrgChart

Registered only OrgChart

60 employees in a TDBGrid, bound to a read only diagram view. Post an edit and the chart rebuilds, with compact leaves, department colours, click to select and PNG and SVG export.

NodeEditor

NodeEditor

Typed input and output ports, a connection rule in OnConnecting, curved connectors and blocks painted in OnDrawNode, saved as JSON with their ports and captions.

Registered only FlowchartEditorFMX

The flowchart editor on the FireMonkey view and palette, for Windows and Android, where a tap places a shape and a pinch zooms.

Headless

Registered only Headless

A console program with no VCL or FireMonkey unit that builds a flowchart, arranges it with the layered layout and writes PNG, SVG and JSON, also on Linux64.

Compiled demos

Ready to run executables of every sgcUI product, nothing to install.

Download sgcUI_bin.zip →

Where sgcDiagram Is Included

sgcDiagram is in sgcUI Enterprise, and it is also sold on its own. sgcDiagram is also included in the All-Access bundle.

sgcDiagram single package

€249 / developer, full source code, 1 year of updates.

Buy sgcDiagram → See pricing →

sgcUI Enterprise

All 14 sgcUI products, from €699.

See Enterprise →

The free Community edition (esegece.sgcDiagram.Community on NuGet) leaves out automatic layouts, obstacle avoiding routing, data binding and multiple layers. There is no sgcWebSockets bridge for sgcDiagram.

FeatureCommunity (free)Registered
Palette, view and in place editing✓✓
14 shapes, ports, groups and containers✓✓
Straight, orthogonal and curved connectors✓✓
Undo, clipboard, snapping and guides✓✓
JSON files, PNG and SVG export✓✓
Light and dark themes, viewer mode✓✓
Layered and tree layouts−✓
Obstacle avoiding orthogonal routing−✓
Data binding−✓
More than one layer−✓

Supported Frameworks and Platforms

Components in sgcDiagram

Views and palettes

TsgcVCLDiagramView and TsgcVCLDiagramPalette for VCL, TsgcFMXDiagramView and TsgcFMXDiagramPalette for FireMonkey.

Model and controller

TsgcDiagramDocument, TsgcDiagramNode, TsgcDiagramConnector and TsgcDiagramController, with no user interface dependency.

Renderer and layouts

TsgcDiagramRenderer writes PNG and SVG without a window. TsgcDiagramLayeredLayout and TsgcDiagramTreeLayout arrange the diagram. Registered

.NET views

TsgcWinFormsDiagramView, TsgcWpfDiagramView and TsgcAvaloniaDiagramView, each with its palette, in the namespace esegece.sgcDiagram.

TargetComponentPlatforms
Delphi 7 to 13, VCLTsgcVCLDiagramView, TsgcVCLDiagramPaletteWin32 and Win64
Delphi XE6 to 13, FireMonkeyTsgcFMXDiagramView, TsgcFMXDiagramPaletteWindows, macOS, iOS and Android
C++ Builder 2007 to 13The same componentsGenerated .hpp headers and static libraries
Delphi 10.2 to 13, headlessDocument, JSON, routing, layouts, PNG and SVG rendererLinux64, for example to render diagrams on a server
.NET Framework 4.7.2, .NET 8, 9 and 10WinForms, WPF and Avalonia viewsWindows, Linux and macOS, headless JSON, PNG and SVG

Frequently Asked Questions

Yes, that is what the view and the palette are for. Users drag shapes, draw connectors from the ports, edit text in place, group, copy and paste, and undo or redo every action. Set ReadOnly when a user should only look, or lock single items and layers to protect part of a diagram while the rest stays editable.

Yes, in two ways. In code, AddNode and AddConnector inside BeginTransaction and EndTransaction build any diagram as one undo step. In the Registered edition, TsgcDiagramDataBinding builds it from a dataset with a key and a parent column and rebuilds it when the data changes. In .NET it reads a DataTable.

Two, in the Registered and Trial editions. TsgcDiagramLayeredLayout arranges directed graphs such as flowcharts, state machines and dependency graphs in layers with few crossings. TsgcDiagramTreeLayout arranges hierarchies such as org charts and category trees, with a compact leaves style. Both work in four directions and run as one undo step.

Not in version 1. Diagrams export to PNG and SVG, from the view or with TsgcDiagramRenderer without a window. SVG scales without loss, so it suits print and documents, and a PNG saved with a scale of 2 stays sharp on slides. Printing is not part of version 1 either.

Four advanced features: the automatic layouts, obstacle avoiding orthogonal routing (Community draws simple elbows), data binding, and layers beyond the first. Everything else is there: every shape, the three connector kinds, ports, containers, undo, the clipboard, JSON, PNG and SVG, themes, snapping and guides. Registered and Trial have everything.

Yes. The JSON format is the same on every platform and in every edition, so a diagram saved by a Delphi or C++ Builder application opens in a WinForms, WPF or Avalonia application and the other way round. A file saved by the Registered edition also opens in a Community build, which keeps its layer names.

Yes. The FireMonkey view and palette run on Windows, macOS, iOS and Android from Delphi XE6, and the FlowchartEditorFMX demo shows touch editing on Android. In .NET the Avalonia view runs on Windows, Linux and macOS.

sgcDiagram Help

3,000+Developers
20+Years
761+Components
30+API Integrations
5Platforms
30-Day Money-Back GuaranteeNot satisfied? Request a full refund within 30 days of purchase. See refund policy

Try sgcDiagram Today

The sgcUI trial includes sgcDiagram and every other sgcUI product.