Delphi, C++ Builder & .NET Part of sgcUI

sgcPivotGrid, the Pivot Table Grid for Delphi, C++ Builder & .NET

Turn raw rows into answers. Drop fields into rows, columns and values, group dates by year, quarter or month, and let your users build their own layout with a drag and drop field list. A typed column store recalculates a million rows in a fraction of a second, and a double click shows the source rows behind any cell.

VCL, FireMonkey, WinForms, WPF, Avalonia1,000,000 rows: 100 ms recalculation budget on Win64Free .NET Community editionIncluded in sgcUI Enterprise
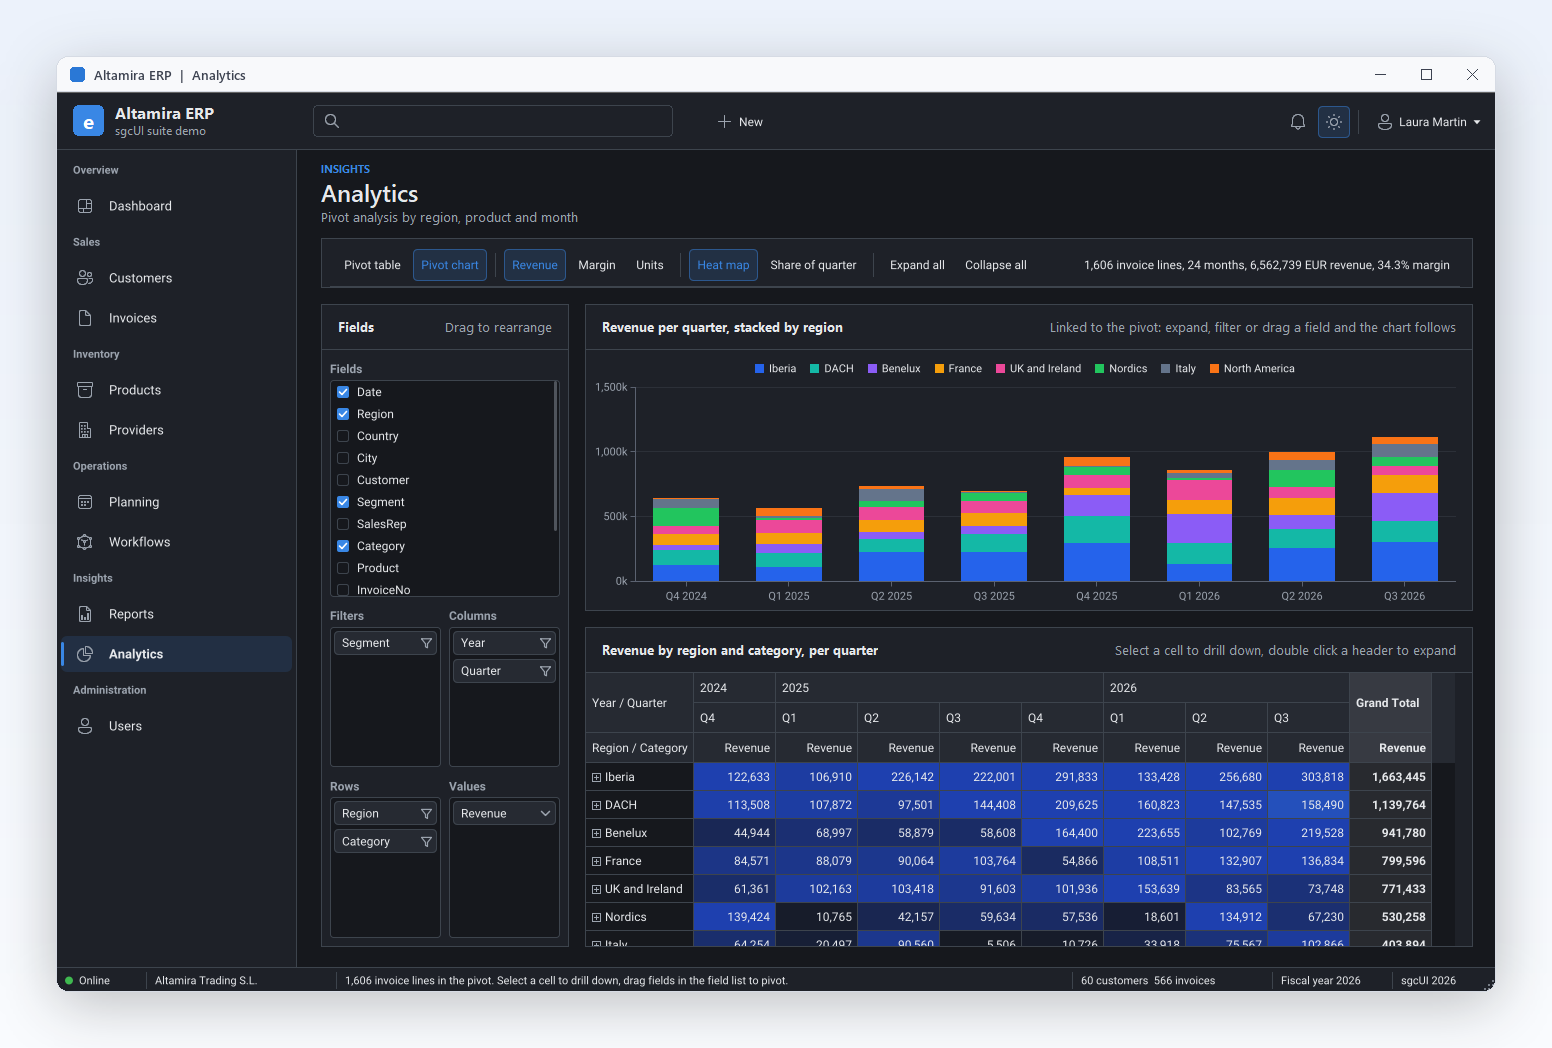
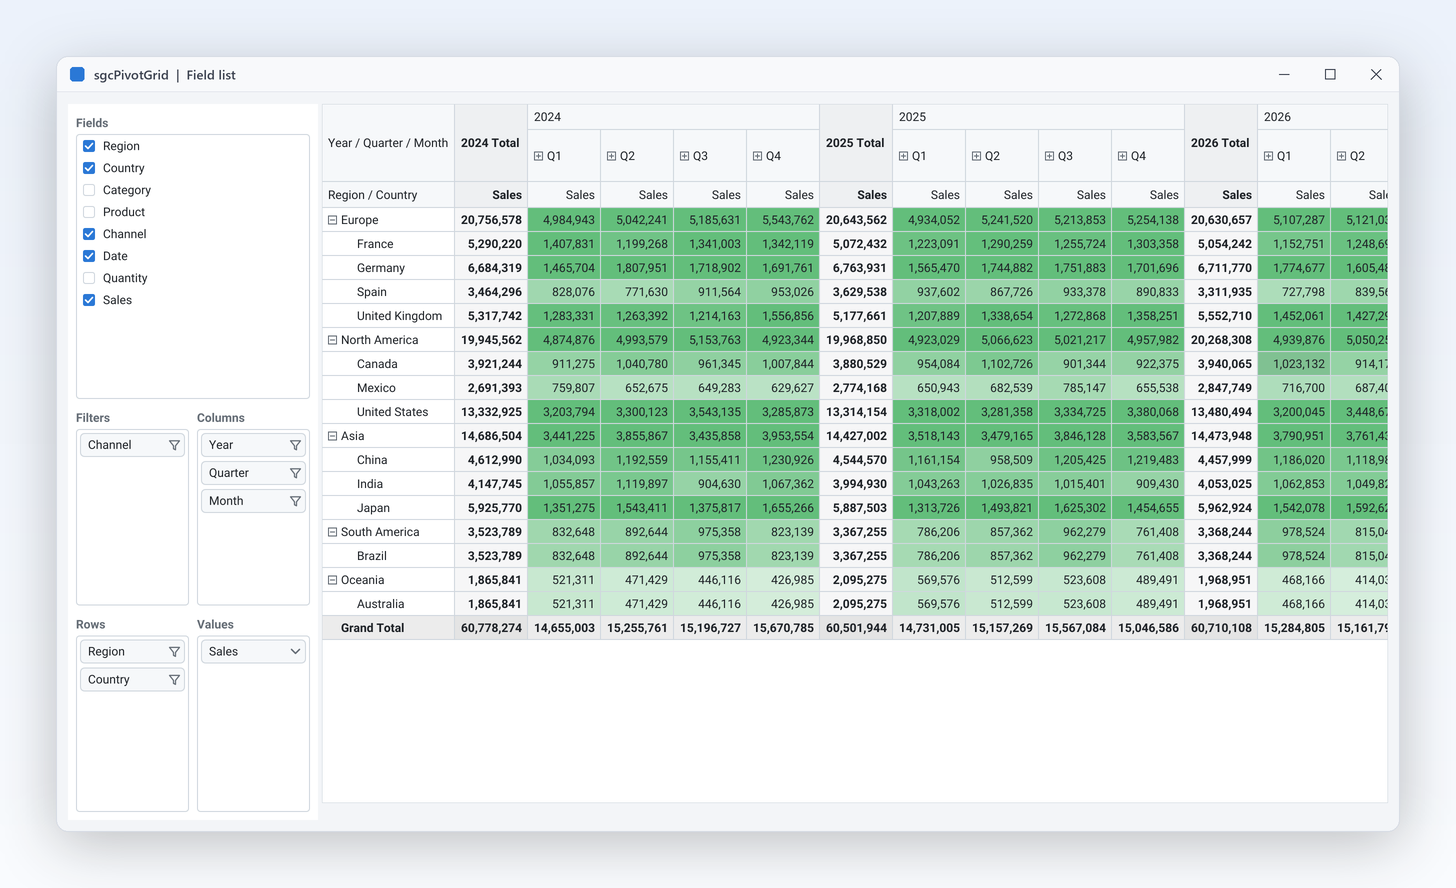
SalesPivot demo: the field list with Filters, Columns, Rows and Values areas next to the pivot it builds

Everything a Pivot Table Needs

Thirteen features in five groups. Features marked Registered are not in the free .NET Community edition.

Speed and Data

Load once, recalculate once, with or without a window.

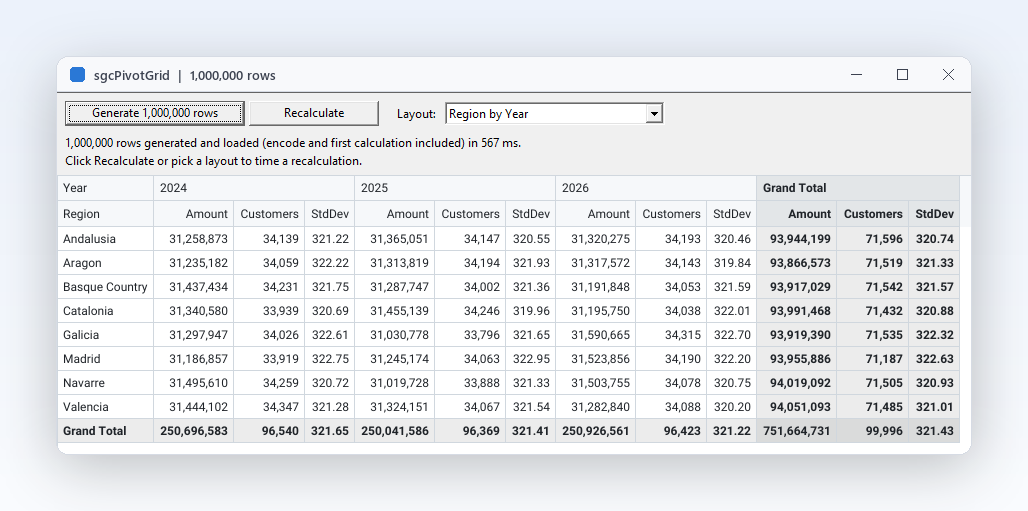
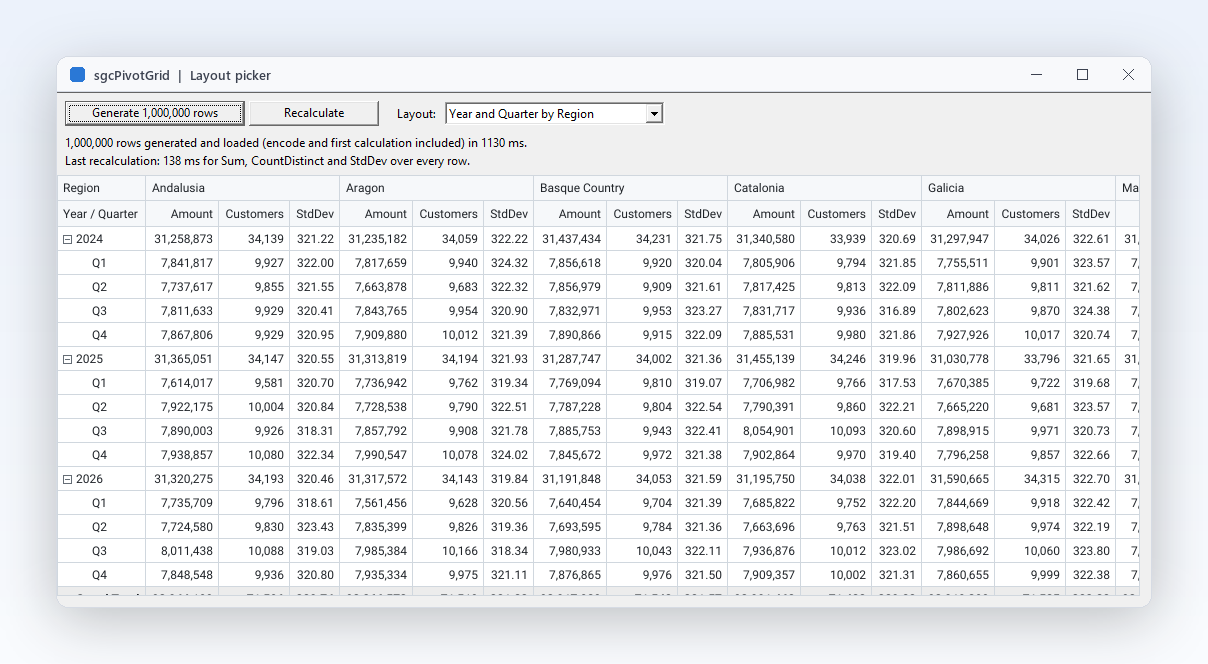
MillionRows demo after pivoting 1,000,000 rows, with the timing label it prints

Speed and Data

Pivot a million rows in a fraction of a second

Order histories and sensor logs quickly outgrow a spreadsheet. sgcPivotGrid keeps every column in a typed column store, aggregates the cells in one pass over the source rows and draws only the visible part of the result. The QA budget for recalculating 1,000,000 rows is 100 ms on Win64, and the MillionRows demo loads and pivots a million rows and prints its own timing.

  • TsgcPivotEngine is the engine, published as Pivot on the grid and usable on its own
  • BeginLoad, DefineColumn, AppendRow and EndLoad load the rows with one recalculation at the end
  • BeginUpdate and EndUpdate group layout changes into a single pass
  • Text columns are dictionary encoded, and totals come from the source values, never from averages of averages
Read the help topic
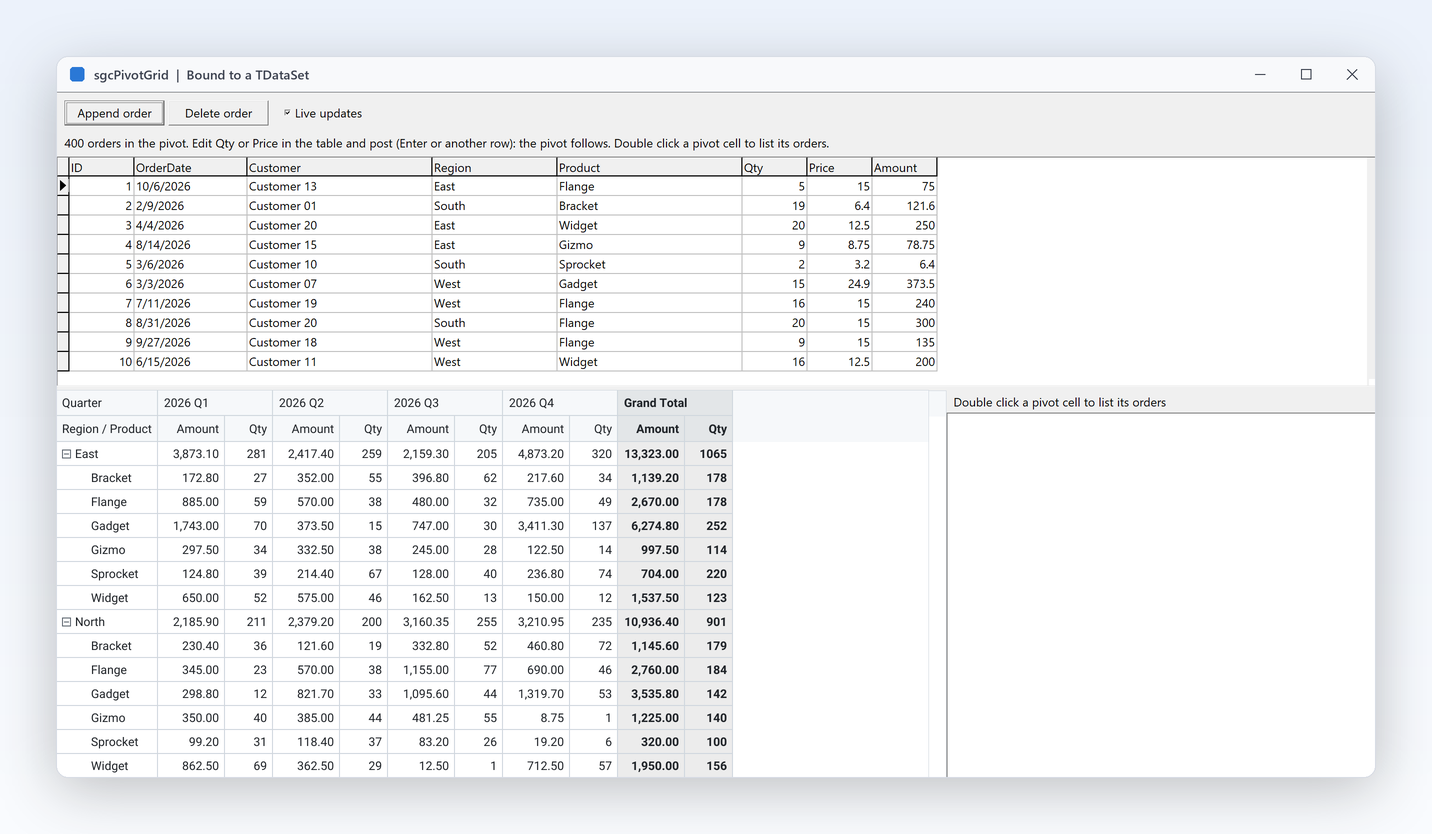
DataSetPivot demo: an order table above a pivot that follows the edits

Speed and Data

Feed it from a TDataSet, a grid or your own code

Point the pivot at the data you already have. A dataset source copies any TDataSet into the engine and, with live updates on, reloads it after every post, so the pivot follows the edits your users make in a form. A table source reads any IsgcUITable, such as an sgcGrid, and reloads only when the table changes. Code that already holds the rows in memory simply appends them. The pivot never writes back to your data.

  • TsgcPivotSource_DataSet with DataSet, Active, Columns and LiveUpdates
  • Any TDataSet descendant works, because the source reads it through a TDataLink
  • TsgcPivotSource_Table reads an sgcGrid or any other IsgcUITable and reloads when TableVersion moves
  • In .NET the same engine reads a DataTable
Read the help topic

Analysis

The questions a sales manager asks, answered with properties.

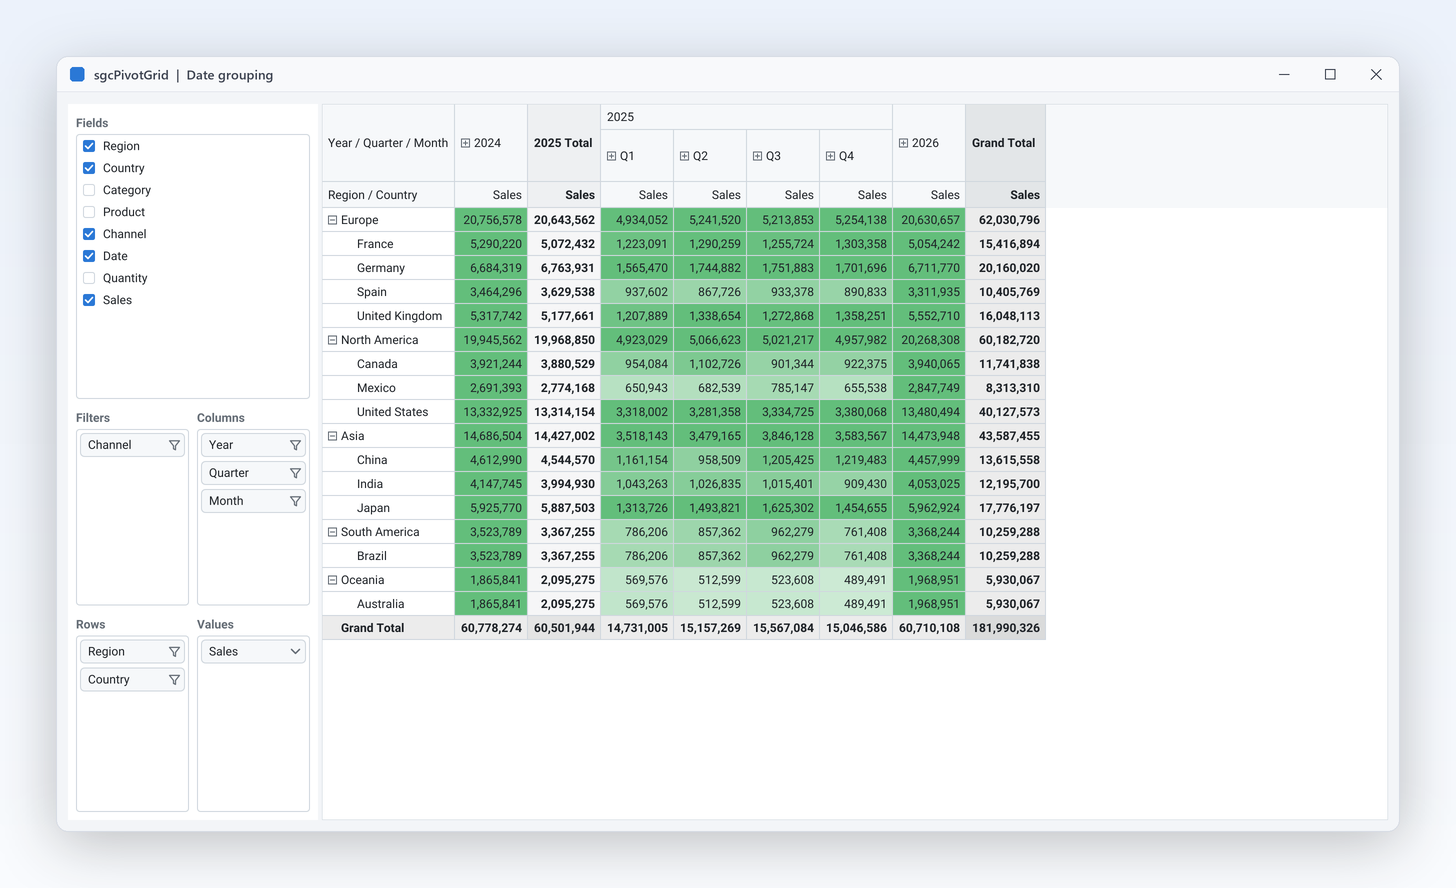
Pivot with 2025 expanded to quarters and months and 2024 collapsed

Analysis

Dates grouped the way people think

Nobody reads a sales report one day at a time. Add the same date field to the columns several times with a different grouping and sgcPivotGrid builds Year, Quarter and Month levels from it, each with its own subtotal. Users open and close the levels with the plus and minus buttons, and your code can expand a whole level at once. Expanding or collapsing builds a new snapshot without aggregating the data again. Week and Day groupings are there for operational reports that need them.

  • TsgcPivotDateGrouping: pvdYear, pvdQuarter, pvdMonth, pvdWeek and pvdDay
  • AddField('Date', pvaColumn, pvdQuarter) adds one level per call
  • ExpandAll, CollapseAll and ExpandLevel for each axis
  • Subtotals and grand totals with their own position and caption
Read the help topic
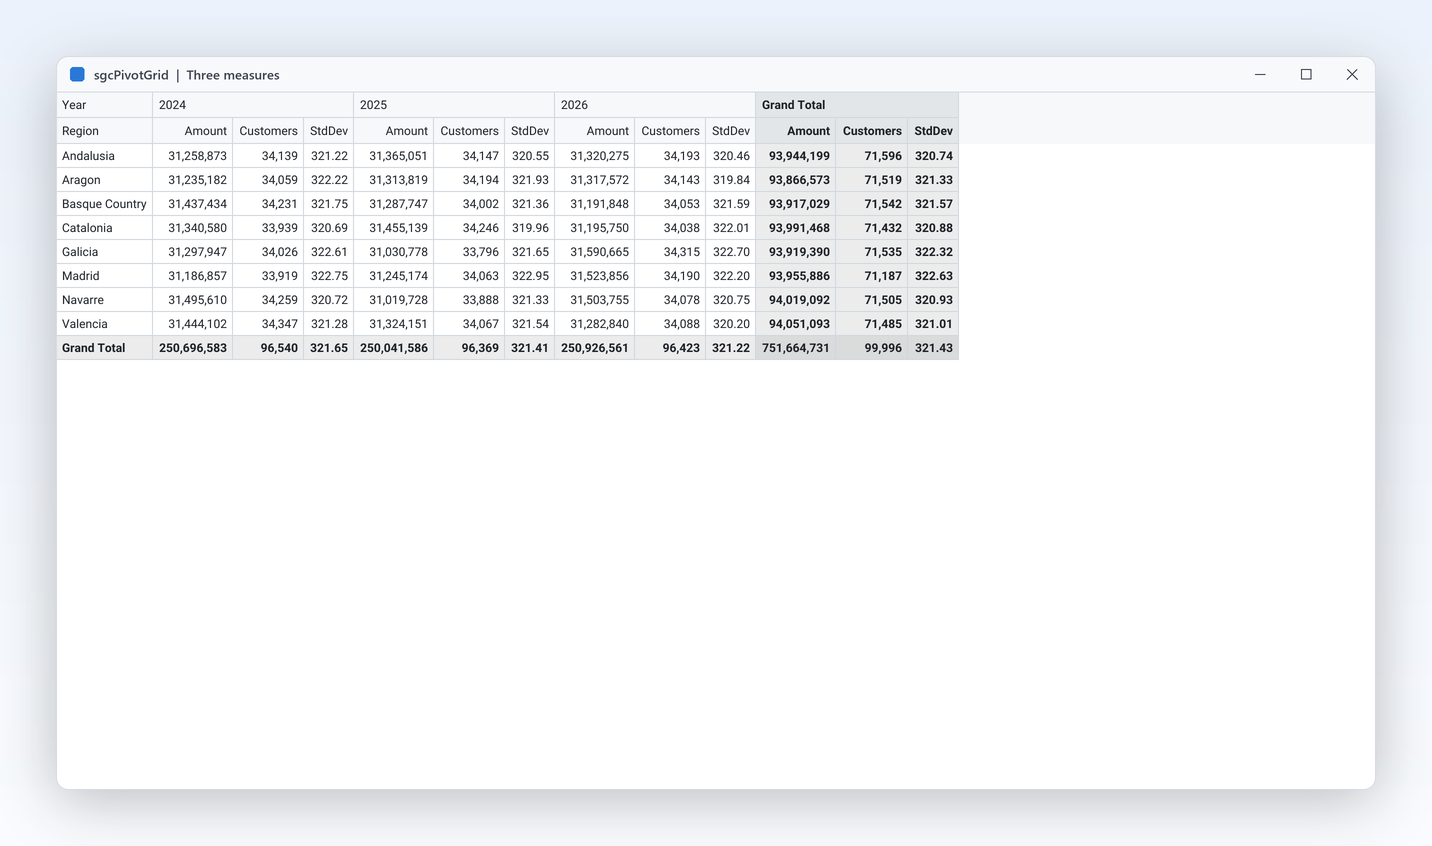
Three measures side by side: sum of amount, distinct customers and average margin

Analysis

Eight aggregations, including distinct count

Revenue is a sum and an order count is a count, but how many different customers bought in March is a distinct count, and that is the figure finance teams ask for. Each data field picks its own aggregation, so one layout can show the sum of sales, the number of distinct customers and the average margin side by side. In the field list, the button of a Values chip switches the aggregation with one click. Totals are always computed from the source values.

  • TsgcPivotAggregation: pvfSum, pvfCount, pvfAverage, pvfMin and pvfMax
  • pvfCountDistinct, pvfStdDev and pvfVar for statistics
  • AddDataField('Sales', pvfSum) adds a measure, and several measures sit under each column member
  • All eight are in the free Community edition
Read the help topic
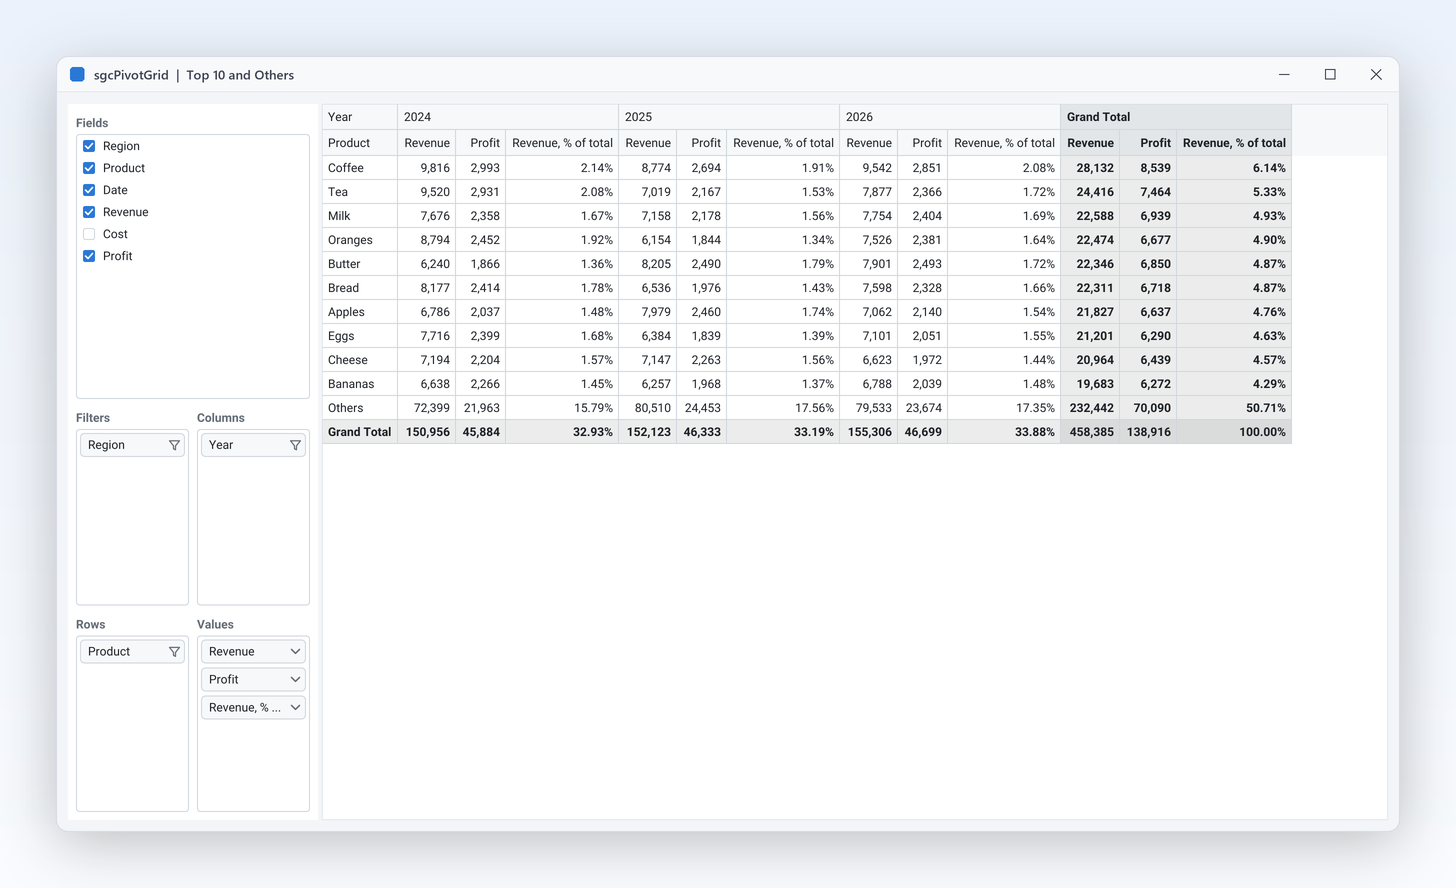
Top 5 products by sales plus an Others row, with the member checklist open

Analysis Registered only

Filter to what matters, keep the top N

Large layouts are only useful when users can narrow them. Member, label and value filters cut the result down, with 13 operators from equal to between and contains. Top N keeps the members with the largest totals within each parent and can fold the rest into a single Others row, so the totals still add up. A drill down on Others returns the source rows of every member it holds.

  • TsgcPivotFilterOperator: pvcEqual, pvcGreater, pvcBetween, pvcContains, pvcBeginsWith and more
  • FilterValues and FilterExclude for member checklists, also from the field list
  • TopN, TopNOthers and OthersCaption for the Top N view
  • SortBy pvsValue with pvoDescending lists the largest first

Member, label and value filters and sorting are in the Community edition. Top N with Others is Registered.

Read the help topic
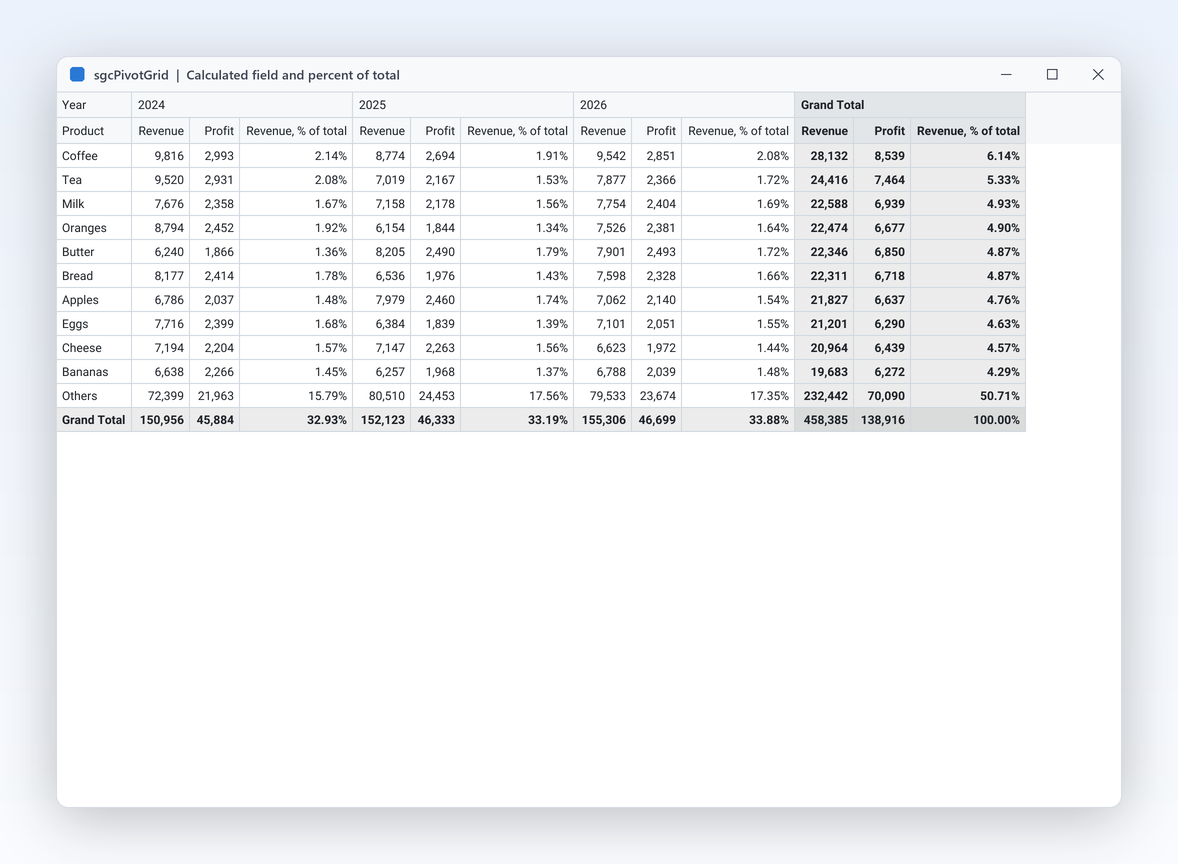
AdvancedPivot demo with a calculated margin field and percent of column total

Analysis Registered only

Calculated fields and percent of total

Margins, profit and shares are the numbers managers discuss, and they rarely exist as columns in the database. A calculated field computes a value for every source row from an expression, with IF, ROUND, MIN, MAX, ISNULL and date functions, and is then aggregated like any other column. Show values as turns a measure into percent of row, column or grand total, a running total, a difference from a base item or a rank.

  • CalculatedFields.Add returns a TsgcPivotCalculatedField with Name and Expression
  • Row level evaluation: the sum of a calculated profit is the sum of the profits
  • ShowAs: pvwPercentOfRow, pvwPercentOfColumn, pvwPercentOfGrandTotal, pvwRunningTotal, pvwDifferenceFrom, pvwRank
  • ShowAsBaseItem picks the member a difference is measured from

Not in the Community edition: these members are compiled under SGC_PIVOTGRID_ADVANCED.

Read the help topic

Interaction

Let your users find the answer themselves.

Interaction

Users build their own report by drag and drop

A new question should not need a new release. Put a field list next to the grid, set one property, and users drag source columns into Filters, Columns, Rows and Values. A text column dropped on Values counts, a numeric one sums, and the chip button switches the aggregation. Each chip opens a member checklist with a search box, and deferred mode keeps the changes pending until the user applies them, which helps on very large data. The same field list works in FireMonkey.

  • TsgcVCLPivotFieldList and TsgcFMXPivotFieldList, bound through PivotGrid
  • Four areas: pvaFilter, pvaColumn, pvaRow and pvaData
  • DeferUpdate and ApplyChanges recalculate once, when the user is done
  • WinForms, WPF and Avalonia field lists in .NET
  • Right to left for Arabic and Hebrew: the row header area, the column order, the chevrons and the field list are mirrored, and the XLSX export writes a right to left sheet
Read the help topic
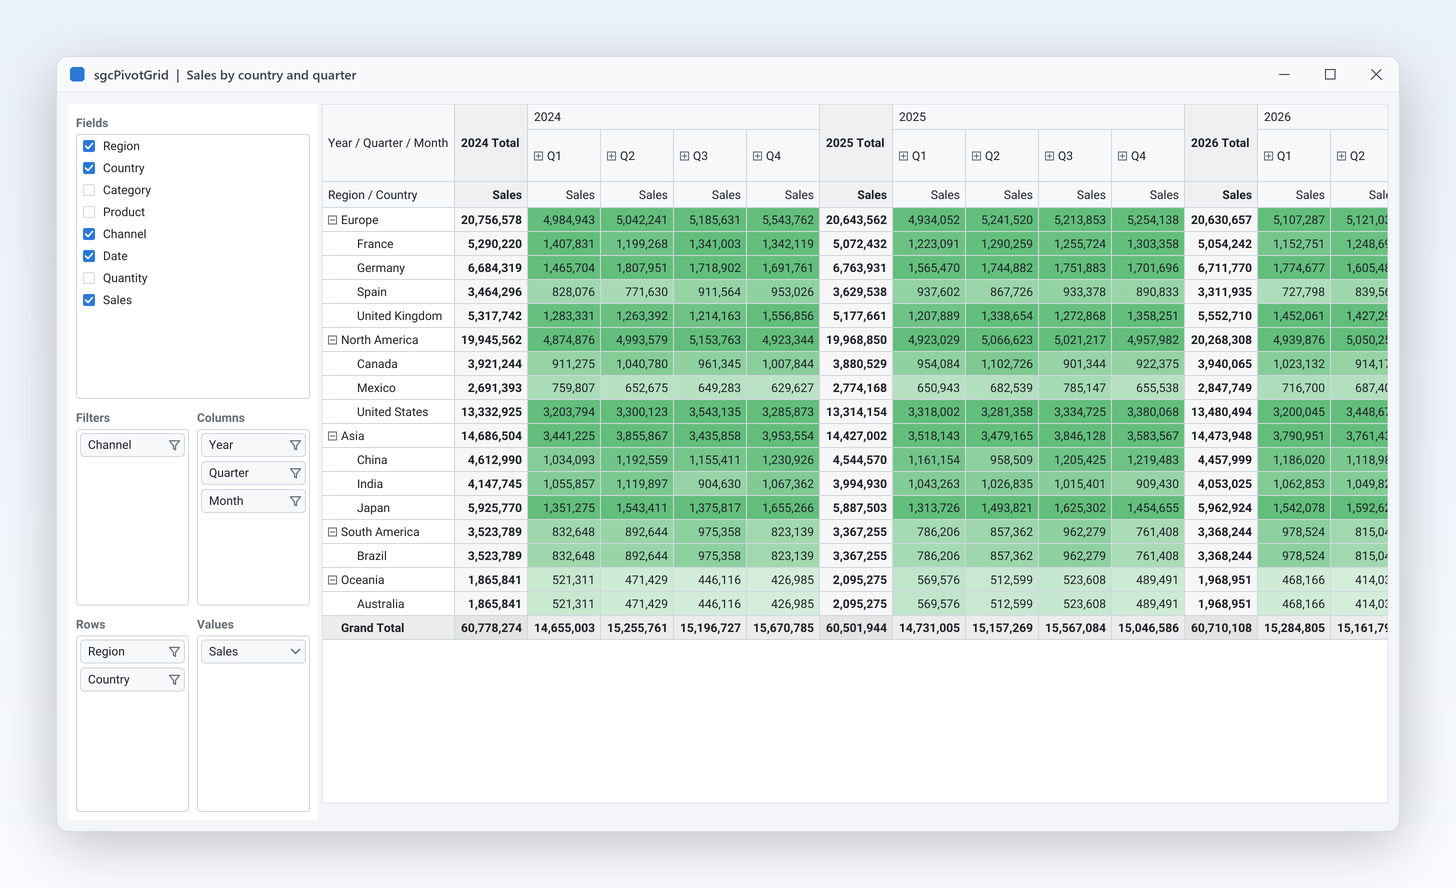
Country by month pivot with a green colour scale on the sales values

Interaction

Colour scales show hot spots instantly

A grid of numbers hides the story until someone colours it. Format rules tint the data cells by their values: a colour scale shades each cell between two colours by its place between the smallest and the largest value of the measure, and value rules colour or bold the cells that match a condition. The same rules apply on screen and in the PNG and SVG images, because both are drawn by the same renderer. No custom drawing code is needed.

  • TsgcPivotFormatRule in the FormatRules collection, editable in the Object Inspector
  • pvrColorScale with MinColor and MaxColor
  • pvrValue rules with an operator, BackColor, ForeColor and Bold
  • Measure chooses the data field, and Theme switches between light and dark
Read the help topic
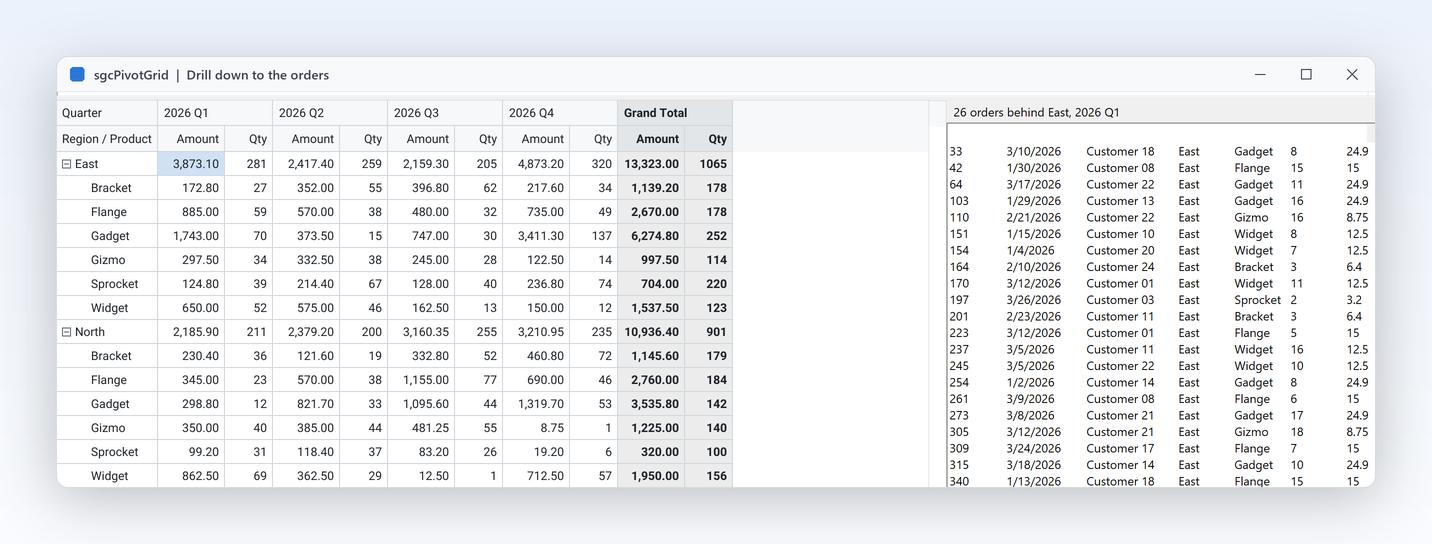
DataSetPivot demo with the orders behind one pivot cell listed beside the grid

Interaction

Drill down to the rows behind any number

When a total looks wrong, the first question is which orders make it up. A double click on a cell, or Enter on the keyboard, drills down, and the engine returns the source rows that were aggregated into that value, as row numbers or as a table with every column of the store, including the columns that are not in the layout. The DataSetPivot demo lists the orders behind a cell in a side panel.

  • OnDrillDown of the grid, and DrillDownCell to trigger it from code
  • DrillDown returns the source rows as an IsgcUITable
  • GetSourceRows gives the row numbers and SourceValue reads a value
  • A drill down on the Others row of Top N returns the rows of every member it holds
Read the help topic

Interaction

Ask for a layout in plain language

Users type a question such as top 3 countries by sales per quarter, in the AI query bar or from your code, and TsgcPivotGridAI asks an AI provider for the layout. Any LLM works: TsgcUIAIEventProvider hands each request to your own code, and TsgcUIAIChatProvider uses the TsgcAIChat component of sgcWebSockets. Only the question and the field catalog leave the application: names, captions, types and up to 5 sample values per field, never the rows. The answer is checked against the real fields before it is applied in one recalculation, and Undo restores the previous layout.

  • TsgcPivotGridAI with Provider and PivotGrid, on VCL, FireMonkey, WinForms, WPF and Avalonia
  • Ask waits for the answer, AskAsync runs on a worker thread and Cancel stops it
  • OnBeforeAsk can edit or cancel the request, OnLayout can refuse the answer
  • MaxSampleValues limits the samples; unknown fields are dropped and the answer is capped at 64 KB
  • TsgcPivotGridAIQuery of the sgcPivotGridWS bridge still works with Chat, and an assigned Provider wins over Chat

Every edition and every platform, Community included; Undo of an AI layout is not in the Community edition. The sgcWebSockets provider needs a Registered edition with a registered sgcWebSockets: sgcUICoreWS in Delphi and C++ Builder, the esegece.sgcUICore.sgcWebSockets package in .NET.

Read the help topic

Output

A file, a browser, a chart or a server job.

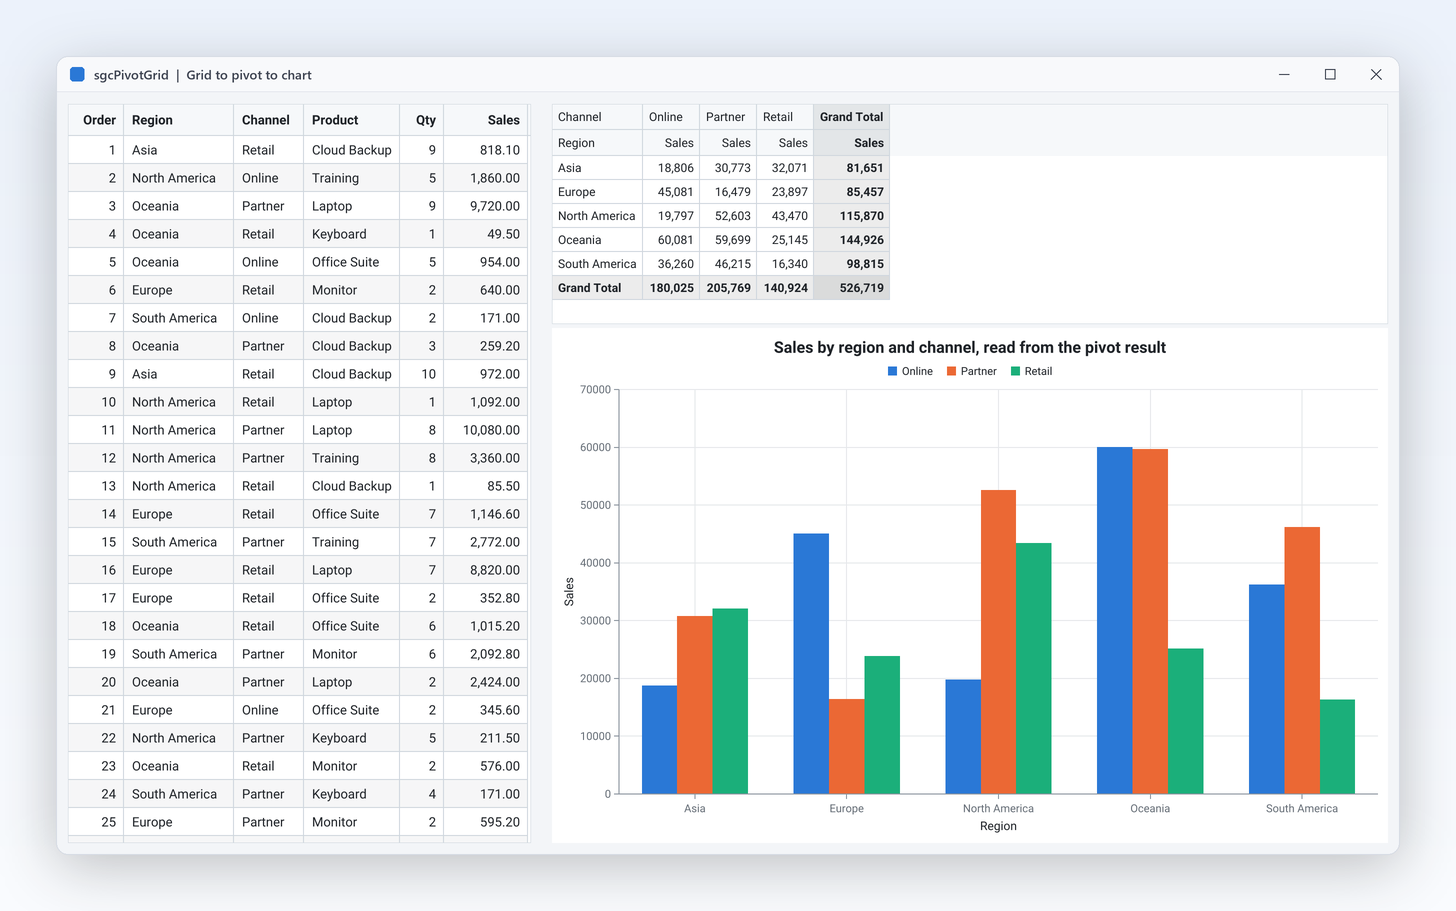
GridToPivotToChart demo: grid rows, the pivot and an sgcCharts chart in three panes

Output

Export what you see, or chart it

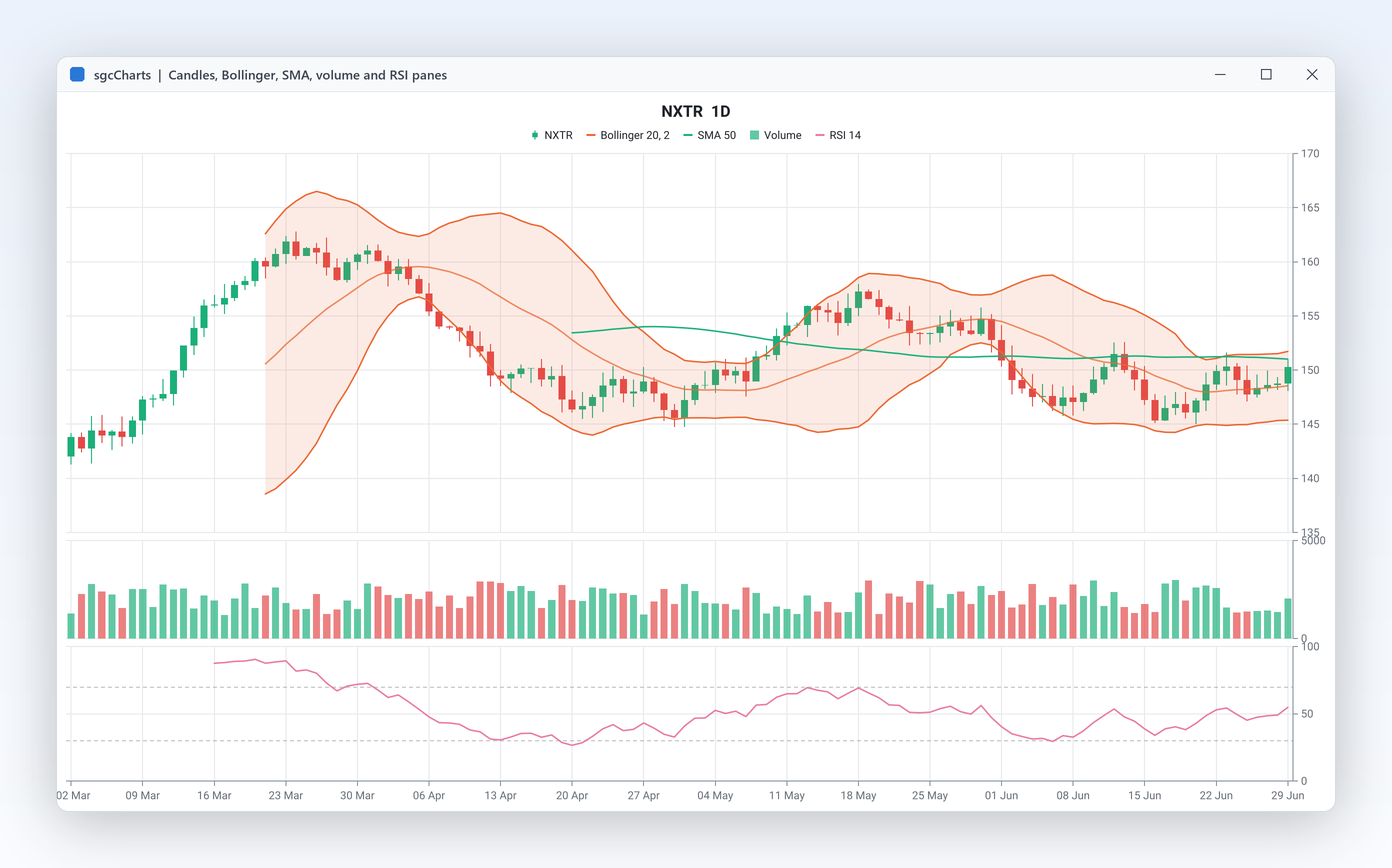
A pivot is often the start of a report, not the end. Every export writes the view as the user arranged it, with its expanded levels and filters: CSV for spreadsheets, JSON for other systems, HTML for a browser or an email, PNG and SVG for documents. The result is also a table that sgcCharts reads directly, so the GridToPivotToChart demo goes from grid rows to a pivot to a chart without copying any data. Streams work as well as files.

  • SaveToCSV, SaveToJSON and SaveToHTML to a file or a stream
  • SaveToPNG and SaveToSVG with an optional size
  • TsgcPivotGridRenderer draws without a window, on a server or on Linux64
  • ResultTable exposes the visible result as an IsgcUITable for sgcCharts
Read the help topic
Layout list with Sales by region and Margin by product saved views

Output Registered only

Save a layout, restore it with one call

Power users build the same views again and again: sales by region on Monday, margin by product at month end. Layout persistence writes the whole layout as JSON, with its fields, areas, groupings, aggregations, sorting, filters and totals, and loads it back with one recalculation. Keep it in a file, a database field or a user profile, offer a list of named views, or copy the layout of one grid to another.

  • SaveLayoutToFile and LoadLayoutFromFile on the grids and the engine
  • SaveLayoutToString and LoadLayoutFromString for a database or a settings store
  • The grid versions also keep the column widths the user changed
  • Copy a layout between grids with LoadLayoutFromString(SaveLayoutToString)

Not in the Community edition.

Read the help topic
Accessibility

UI Automation for screen readers, the keyboard and high contrast, with no setup.

Accessibility

A pivot table exposed with its headers

sgcPivotGrid exposes its content to Microsoft UI Automation as a table with row and column headers that expand and collapse, data cells and totals. The field list is exposed as one list of fields per area, so a screen reader user can build the pivot too.

  • Arrows, Home, End, Page Up and Page Down move the focused cell, and Left and Right (or the plus and minus keys) collapse and expand headers
  • In the field list, Up and Down move the field focus, Ctrl+1 to Ctrl+4 move the field to rows, columns, values or filters, Ctrl+Up and Ctrl+Down reorder it, Space toggles it and Del removes it
  • The field list keys replace dragging fields with the mouse
  • A visible focus ring, and under a Windows high contrast theme the pivot grid paints with the system colours

Accessibility is on by default in every edition, the free Community edition included, on VCL in every Delphi and C++Builder version from Delphi 7 to Delphi 13, on FireMonkey on Windows, and on WinForms, WPF and Avalonia. In Delphi and C++Builder, AccessibleName and AccessibleDescription set the name and the description exposed to UI Automation, and in .NET the standard accessible name and help text of each framework do the same. See the accessibility conformance reports.

Read the help topic

See sgcPivotGrid in action

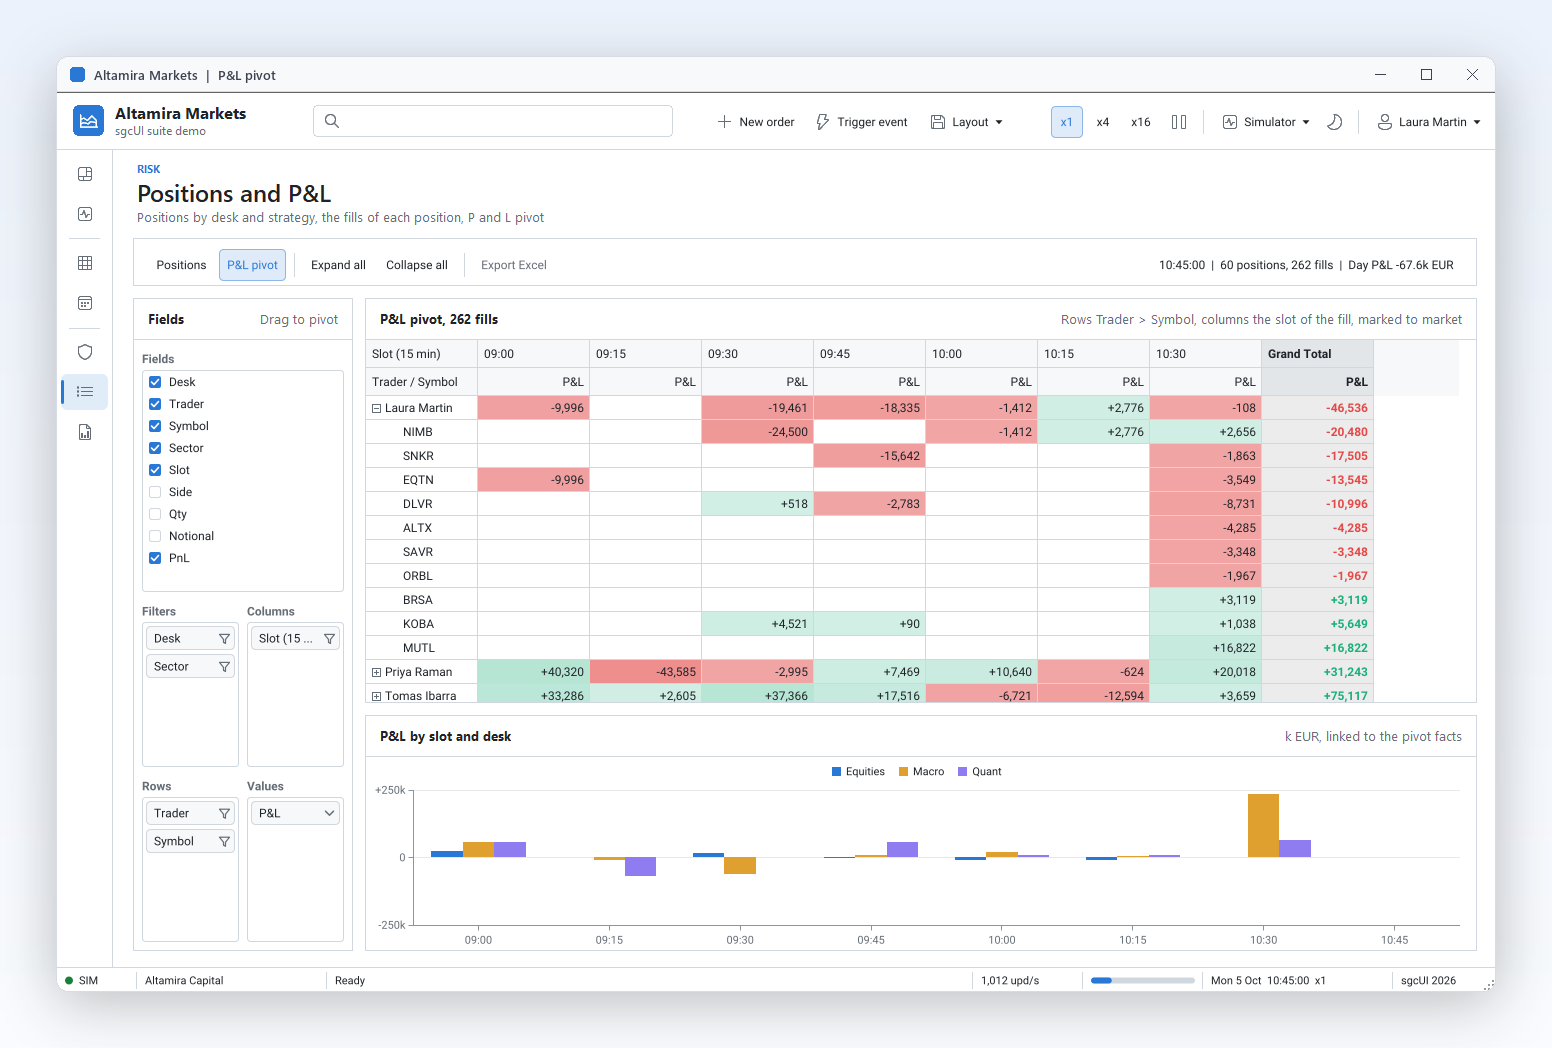
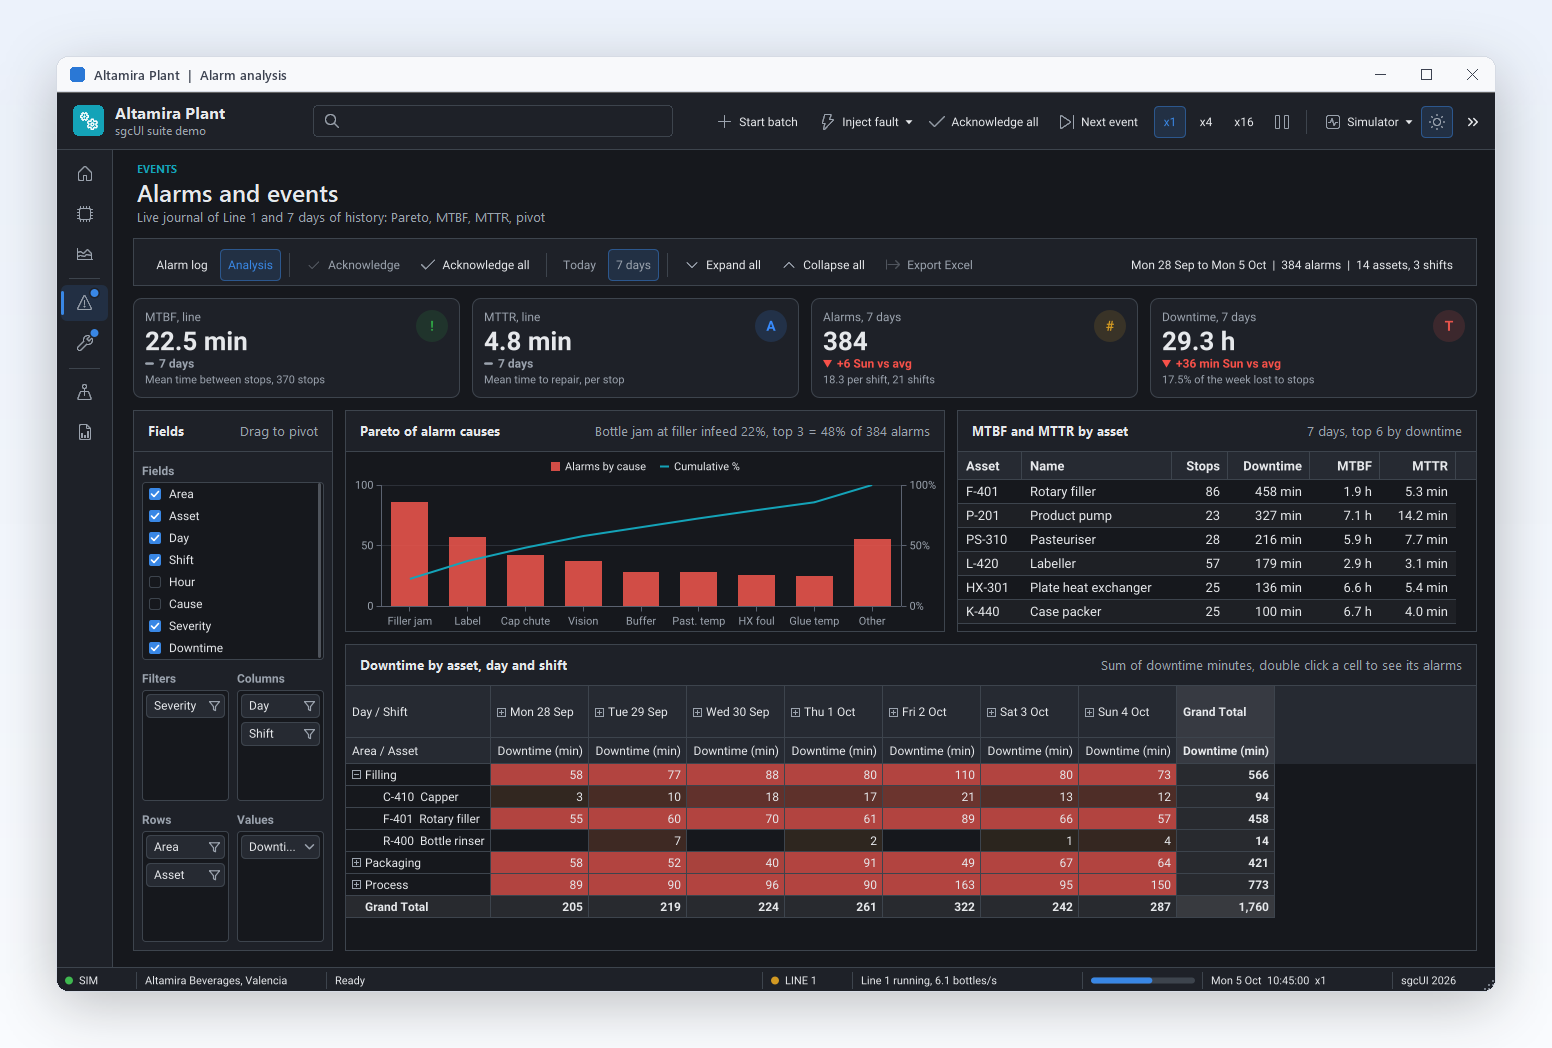
sgcPivotGrid inside the sgcUI suite demos: complete applications that run offline with built-in simulated data.

Measured Against Budgets

The QA performance group runs these scenarios on release builds, as the median of five runs on fixed data. The figures are budgets each scenario must stay within, published in the help.

MeasurementResultConditions
Recalculate 1,000,000 rows (2 row fields, 1 column field, 1 Sum)100 msWin64 release build, QA budget
Recalculate 1,000,000 rows (2 row fields, 1 column field, 1 Sum)160 msWin32 release build, QA budget
AppendRow of 1,000,000 rows (3 text, 1 float and 1 date value)900 msWin64 release build, QA budget
AppendRow of 1,000,000 rows (3 text, 1 float and 1 date value)1,400 msWin32 release build, QA budget

Source: the help topic that documents these numbers.

Who Builds with sgcPivotGrid

ERP and line of business developers

Sales and finance analysis inside an ERP

Give accounting and sales staff a pivot over the orders table without exporting to a spreadsheet. A dataset source binds the pivot to the same TDataSet your forms use and follows every posted edit. Dates group by year, quarter and month, a colour scale marks the weak regions, and a double click lists the invoices behind a suspicious total, so questions are answered inside your application.

  • Dataset source with live updates
  • Date grouping
  • Colour scales
  • Drill down
Run the DataSetPivot demo

Analysts and controllers

Self service analysis for power users

Power users want to explore, not to file change requests. The field list lets them drag fields between rows, columns, filters and values, member checklists narrow the data, and saved layouts bring back their favourite views. With the AI bridge they can also type a question and get the layout built for them, with Undo one click away when the answer is not what they meant.

  • Field list
  • Top N with Others
  • Layout persistence
  • AI layouts
Run the AdvancedPivot demo

Back office and reporting services

Scheduled reports on a server

Nightly summaries do not need a screen. The engine and the headless renderer run in a service or a console application, on Windows or on Linux64 from Delphi 10.2. Load the day's rows, apply a saved layout and write the pivot as PNG, SVG, HTML or CSV, ready to attach to an email or to publish on an intranet page.

  • TsgcPivotEngine without a window
  • TsgcPivotGridRenderer
  • HTML and CSV export
  • Linux64
Run the HeadlessReport demo

A Pivot Table in a Few Lines

The same API in Delphi, C++ Builder and C#: load 100,000 rows once, then lay out regions by quarter with the largest region first.

A VCL form with a pivot grid and a field list: 100,000 rows loaded with one recalculation, regions by quarter, largest region first.

unit frmSales;

interface

uses
  Classes, Controls, Forms, SysUtils,
  sgcUICore_Theme, sgcPivotGrid_Types, sgcPivotGrid_Fields, sgcPivotGrid_VCL,
  sgcPivotGrid_FieldList_VCL;

type
  TFormSales = class(TForm)
    procedure FormCreate(Sender: TObject);
  end;

implementation

procedure TFormSales.FormCreate(Sender: TObject);
const
  Regions: array[0..3] of string = ('North', 'South', 'East', 'West');
var
  vGrid: TsgcVCLPivotGrid;
  vList: TsgcVCLPivotFieldList;
  vField: TsgcPivotField;
  i: Integer;
begin
  vGrid := TsgcVCLPivotGrid.Create(Self);
  vGrid.Parent := Self;
  vGrid.Align := alClient;
  vGrid.Theme := utDark;
  vList := TsgcVCLPivotFieldList.Create(Self);
  vList.Parent := Self;
  vList.Align := alRight;
  vList.PivotGrid := vGrid;
  // load 100,000 rows, one recalculation at EndLoad
  vGrid.Pivot.BeginLoad(True);
  try
    vGrid.Pivot.DefineColumn('Region', pvtText);
    vGrid.Pivot.DefineColumn('Date', pvtDateTime);
    vGrid.Pivot.DefineColumn('Sales', pvtFloat);
    for i := 1 to 100000 do
      vGrid.Pivot.AppendRow([Regions[i mod 4], EncodeDate(2025, 1, 1) + i mod 365,
        10 + (i mod 97) * 1.5]);
  finally
    vGrid.Pivot.EndLoad;
  end;
  // layout: regions by quarter, the largest region first, shown as % of total
  vGrid.Pivot.BeginUpdate;
  try
    vField := vGrid.Pivot.AddField('Region', pvaRow);
    vField.SortBy := pvsValue;
    vField.SortOrder := pvoDescending;
    vGrid.Pivot.AddField('Date', pvaColumn, pvdQuarter).Caption := 'Quarter';
    vField := vGrid.Pivot.AddDataField('Sales', pvfSum);
    vField.ShowAs := pvwPercentOfGrandTotal;
  finally
    vGrid.Pivot.EndUpdate;
  end;
  vGrid.SaveToHTML(ExtractFilePath(ParamStr(0)) + 'sales.html');
end;

end.

Read the help topic →

The same pivot in C++ Builder, with the headers that the packages generate.

#include <vcl.h>
#pragma hdrstop
#include "sgcUICore_Theme.hpp"
#include "sgcPivotGrid_Types.hpp"
#include "sgcPivotGrid_Fields.hpp"
#include "sgcPivotGrid_VCL.hpp"
#include "sgcPivotGrid_FieldList_VCL.hpp"

void __fastcall BuildSalesPivot(TForm *Form)
{
	TsgcVCLPivotGrid *vGrid = new TsgcVCLPivotGrid(Form);
	vGrid->Parent = Form;
	vGrid->Align = alClient;
	vGrid->Theme = utDark;
	TsgcVCLPivotFieldList *vList = new TsgcVCLPivotFieldList(Form);
	vList->Parent = Form;
	vList->Align = alRight;
	vList->PivotGrid = vGrid;
	// load 100,000 rows, one recalculation at EndLoad
	static const String Regions[4] = {"North", "South", "East", "West"};
	Variant vValues[3];
	vGrid->Pivot->BeginLoad(true);
	try {
		vGrid->Pivot->DefineColumn("Region", pvtText);
		vGrid->Pivot->DefineColumn("Date", pvtDateTime);
		vGrid->Pivot->DefineColumn("Sales", pvtFloat);
		for (int i = 1; i <= 100000; i++) {
			vValues[0] = Regions[i % 4];
			vValues[1] = TDateTime((double)EncodeDate(2025, 1, 1) + i % 365);
			vValues[2] = 10 + (i % 97) * 1.5;
			vGrid->Pivot->AppendRow(vValues, 2);
		}
	}
	__finally {
		vGrid->Pivot->EndLoad();
	}
	// layout: regions by quarter, the largest region first, shown as % of total
	vGrid->Pivot->BeginUpdate();
	try {
		TsgcPivotField *vField = vGrid->Pivot->AddField("Region", pvaRow);
		vField->SortBy = pvsValue;
		vField->SortOrder = pvoDescending;
		vGrid->Pivot->AddField("Date", pvaColumn, pvdQuarter)->Caption = "Quarter";
		vField = vGrid->Pivot->AddDataField("Sales", pvfSum);
		vField->ShowAs = pvwPercentOfGrandTotal;
	}
	__finally {
		vGrid->Pivot->EndUpdate();
	}
	vGrid->SaveToHTML(ExtractFilePath(ParamStr(0)) + "sales.html");
}

Read the help topic →

The C# version for WinForms. It uses only features of the free Community edition.

using System;
using System.Windows.Forms;
using esegece.sgcPivotGrid;
using esegece.sgcUICore;

namespace SalesPivot
{
    internal class MainForm : Form
    {
        private static readonly string[] Regions = { "North", "South", "East", "West" };

        public MainForm()
        {
            Text = "Sales pivot";
            var grid = new TsgcWinFormsPivotGrid { Dock = DockStyle.Fill, Theme = TsgcUITheme.utDark };
            var list = new TsgcWinFormsPivotFieldList { Dock = DockStyle.Right, Width = 260, PivotGrid = grid, Theme = TsgcUITheme.utDark };
            Controls.Add(grid);
            Controls.Add(list);

            // load 100,000 rows, one recalculation at EndLoad
            grid.Pivot.BeginLoad();
            try
            {
                grid.Pivot.DefineColumn("Region", TsgcPivotDataType.pvtText);
                grid.Pivot.DefineColumn("Date", TsgcPivotDataType.pvtDateTime);
                grid.Pivot.DefineColumn("Sales", TsgcPivotDataType.pvtFloat);
                for (int i = 1; i <= 100000; i++)
                    grid.Pivot.AppendRow(Regions[i % 4], new DateTime(2025, 1, 1).AddDays(i % 365), 10 + (i % 97) * 1.5);
            }
            finally { grid.Pivot.EndLoad(); }

            // layout: regions by quarter, the largest region first
            grid.Pivot.BeginUpdate();
            try
            {
                var region = grid.Pivot.AddField("Region", TsgcPivotArea.pvaRow);
                region.SortBy = TsgcPivotSortBy.pvsValue;
                region.SortOrder = TsgcPivotSortOrder.pvoDescending;
                grid.Pivot.AddField("Date", TsgcPivotArea.pvaColumn, TsgcPivotDateGrouping.pvdQuarter).Caption = "Quarter";
                grid.Pivot.AddDataField("Sales", TsgcPivotAggregation.pvfSum).DisplayFormat = "#,##0";
            }
            finally { grid.Pivot.EndUpdate(); }
            grid.SaveToHTML("sales.html");
        }

        [STAThread]
        static void Main() { Application.EnableVisualStyles(); Application.Run(new MainForm()); }
    }
}
dotnet add package esegece.sgcPivotGrid.WinForms

Read the help topic →

The Delphi and C++ Builder samples show values as percent of grand total (ShowAs), a Registered edition feature. The C# sample uses only features of the free Community edition.

Run the sgcPivotGrid Demos

Compiled demo executables are in sgcUI_bin.zip, nothing to install. The source of every demo ships with the package, for Delphi, C++ Builder and .NET.

SalesPivot

SalesPivot

100,000 sales rows with date grouping, a colour scale, the field list and export. SalesPivotFMX is the FireMonkey twin.

DataSetPivot

DataSetPivot

A TClientDataSet of orders: edit a row and the pivot follows; double click a cell to list its orders.

MillionRows

MillionRows

Loads and pivots 1,000,000 generated rows and prints the time it took.

AdvancedPivot

Registered only AdvancedPivot

Calculated fields, show values as, Top N with Others, and saving and loading layouts.

GridToPivotToChart

GridToPivotToChart

Rows in an sgcGrid feed the pivot, and the pivot result feeds an sgcCharts chart, without copying data.

HeadlessReport

Builds a pivot without a window and renders it to a PNG file.

Registered only AskYourPivot

Type a question in the AI query bar and get a layout, through TsgcPivotGridAI with a canned provider or the TsgcAIChat of sgcWebSockets, with Undo.

Compiled demos

Ready to run executables of every sgcUI product, nothing to install.

Download sgcUI_bin.zip →

Where sgcPivotGrid Is Included

sgcPivotGrid is part of sgcUI Enterprise, and it is also sold on its own. sgcPivotGrid is also included in the All-Access bundle.

sgcPivotGrid single package

€249 / developer, full source code, 1 year of updates.

Buy sgcPivotGrid → See pricing →

sgcUI Enterprise

All 14 sgcUI products, from €699.

See Enterprise →

.NET

The .NET edition has the same price. A free Community edition is on NuGet as esegece.sgcPivotGrid.Community.

See pricing →

The free Community edition is esegece.sgcPivotGrid.Community on NuGet. The table shows what it includes.

FeatureCommunity (free)Registered
Pivot grid and field list (VCL, FireMonkey, WinForms, WPF, Avalonia)✓✓
Eight aggregations, including CountDistinct, StdDev and Var✓✓
Date grouping, subtotals and grand totals✓✓
Filters, sorting and drill down✓✓
Conditional formatting and colour scales✓✓
Export to CSV, JSON and HTML, headless PNG and SVG✓✓
AI pivot layouts with any LLM and the AI query bar✓✓
Calculated fields−✓
Show values as−✓
Top N with Others−✓
Layout persistence−✓
Undo of AI layouts, the sgcPivotGridWS bridge and the sgcWebSockets AI provider−✓

Supported Frameworks and Platforms

Components in sgcPivotGrid

ComponentWhat it does
TsgcVCLPivotGrid, TsgcFMXPivotGridThe pivot table control for VCL and FireMonkey (FMX from XE6).
TsgcVCLPivotFieldList, TsgcFMXPivotFieldListThe drag and drop field list that lets users change the layout.
TsgcPivotEngineThe calculation engine, reachable as Grid.Pivot and usable without a window.
TsgcPivotSource_DataSet, TsgcPivotSource_TablePivot a TDataSet, or any table that implements the sgcUI table interface.
TsgcPivotGridRendererHeadless PNG and SVG output for servers and reports.
TsgcPivotFormatRuleConditional formatting rules such as colour scales.
TsgcPivotGridAIPlain language questions turned into pivot layouts by any AI provider, in every edition and on every platform.
TsgcVCLAIQueryBar, TsgcFMXAIQueryBarThe AI query bar of sgcUICore: type a question, read what was applied, Cancel and Undo.
TsgcUIAIEventProvider, TsgcUIAIChatProvider (sgcUICoreWS)AI providers: any LLM through one event, or the TsgcAIChat of sgcWebSockets (Registered only).
TsgcPivotGridAIQuery (sgcPivotGridWS)TsgcPivotGridAI with the Chat property for a TsgcAIChat of sgcWebSockets. Registered only.
TargetComponentPlatforms
Delphi 7 to 13, VCLTsgcVCLPivotGridWin32 and Win64
Delphi XE6 to 13, FireMonkeyTsgcFMXPivotGridWindows, macOS, iOS and Android
C++ Builder 2007 to 13VCL and FMX pivot gridsGenerated .hpp headers and static libraries
Delphi 10.2 to 13, framework neutralEngine, sources, export, layout JSON, headless rendererLinux64, for example to build pivot reports on a server
.NET Framework 4.7.2, .NET 8, 9 and 10TsgcWinFormsPivotGrid, TsgcWpfPivotGrid, TsgcAvaloniaPivotGridWinForms, WPF, Avalonia, headless PNG and SVG

Frequently Asked Questions

The engine is built for large data: a typed column store, one pass per recalculation and virtual drawing. The QA budgets on Win64 are 100 ms to recalculate 1,000,000 rows and 900 ms to append them. The size of the layout counts too: a layout above MaxCells, 5,000,000 cells by default, raises an error, so group the dates or use Top N.

Yes. TsgcPivotSource_DataSet copies any TDataSet into the engine and, while LiveUpdates is True, reloads it after every post. For a batch of edits switch it off and call Load at the end. The DataSetPivot demo shows a TClientDataSet with live updates and drill down.

No. sgcPivotGrid is an in memory engine inside your application. It reads rows from a dataset, a table or your own code, aggregates them itself and needs no database server and no cube design.

Four advanced features: calculated fields, show values as, Top N with Others and layout persistence, plus the sgcPivotGridWS bridge, the sgcWebSockets AI provider and Undo of an AI layout. AI pivot layouts with your own provider, every aggregation, date grouping, filters, sorting, drill down, format rules, export, the field lists and the headless PNG and SVG output are in Community.

Only the question and the field catalog: field names, captions, types and up to 5 sample values per field, never the rows. The answer is validated against the real fields, unknown fields and values are dropped, and nothing changes when no usable layout is left. It works in every edition with any provider you plug into TsgcUIAIEventProvider; the ready TsgcUIAIChatProvider needs a Registered edition and a registered sgcWebSockets.

Yes. The grids and the engine expose the visible result as an IsgcUITable through ResultTable. Set the Table property of an sgcCharts table data source to the pivot grid, and the chart plots what the user laid out. The GridToPivotToChart demo chains sgcGrid, sgcPivotGrid and sgcCharts.

Yes. TsgcPivotGridRenderer draws a result to PNG or SVG without a window, and the engine exports CSV, JSON and HTML. On Linux64 the framework neutral units compile from Delphi 10.2: the engine, the sources, the export, the layout JSON and the renderer.

sgcPivotGrid Help

3,000+Developers
20+Years
761+Components
30+API Integrations
5Platforms
30-Day Money-Back GuaranteeNot satisfied? Request a full refund within 30 days of purchase. See refund policy

Try sgcPivotGrid Today

The sgcUI trial includes sgcPivotGrid and every other sgcUI product.