
Your Delphi desktop application.
Now on Linux.
With FMXLinux installed, the sgcUI FireMonkey controls run in real desktop applications on Linux64. The same forms and the same code you ship on Windows and macOS, with the same look.
- Delphi
- FireMonkey
- FMXLinux
- Linux64
- Ubuntu 22.04 or later
Linux has always been the hard platform for Delphi desktop developers. The compiler targets Linux64, but a visual application needs FireMonkey, and FireMonkey on Linux needs the FMXLinux add-on. Until now sgcUI offered Linux64 only for the non visual parts: data models, import and export, and headless rendering to PNG and SVG.
That changes today. With FMXLinux installed in the IDE, the sgcUI FireMonkey controls compile and run on Linux64: the data grid, the charts, the gauges, the dashboards, the planner, the maps, the diagrams and the rest of the suite. Every screenshot in this article was taken on Ubuntu, from the same demo projects that run on Windows and macOS.
sgcUI on Linux64 in one minute, recorded from the real demos running on Ubuntu. Also on YouTube.
Full Applications, Not Just Controls
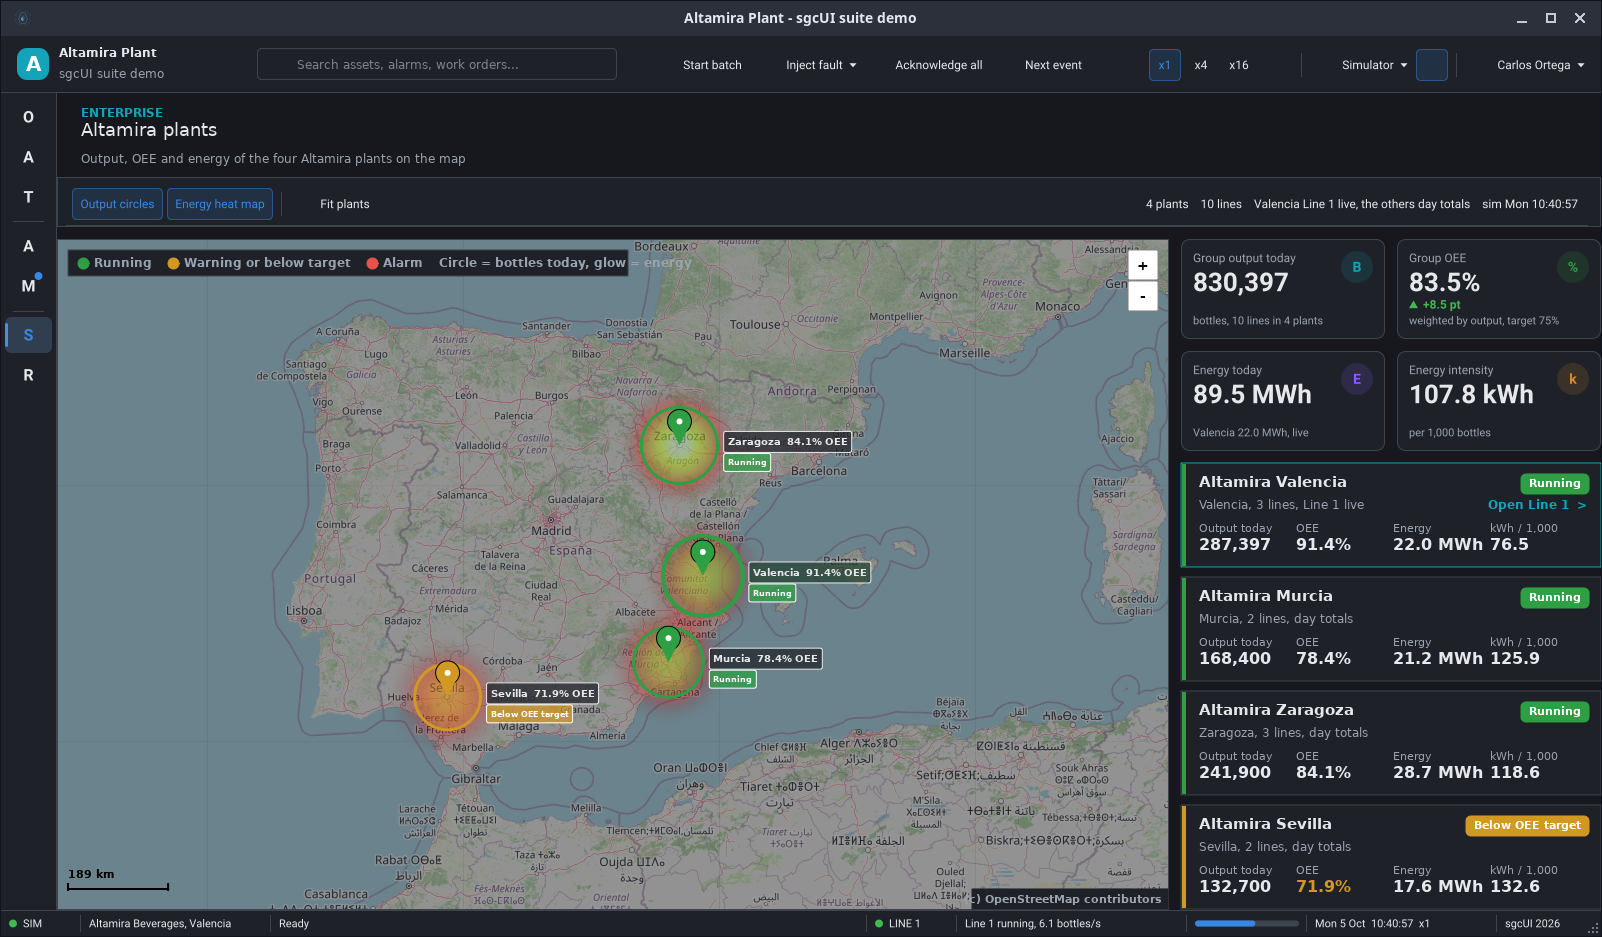
The best way to judge a UI suite is to look at complete applications. The sgcUI Suite demos are exactly that: each one combines a dozen products into one program with navigation, live data and several pages. All of them now run on Linux64, unchanged.
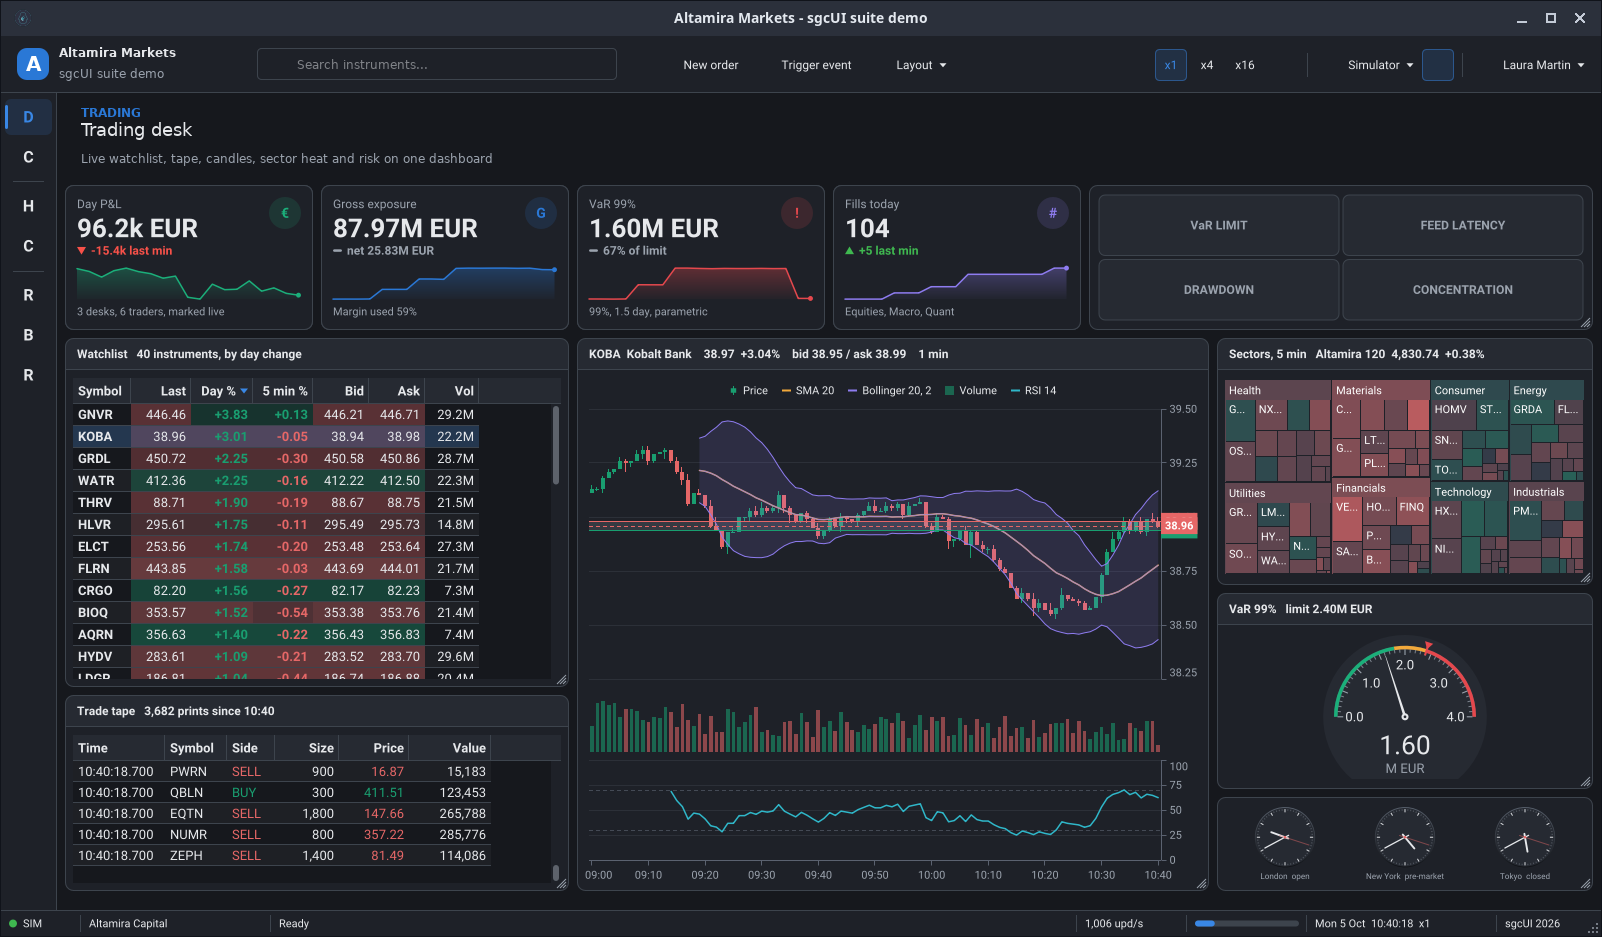
A Trading Desk
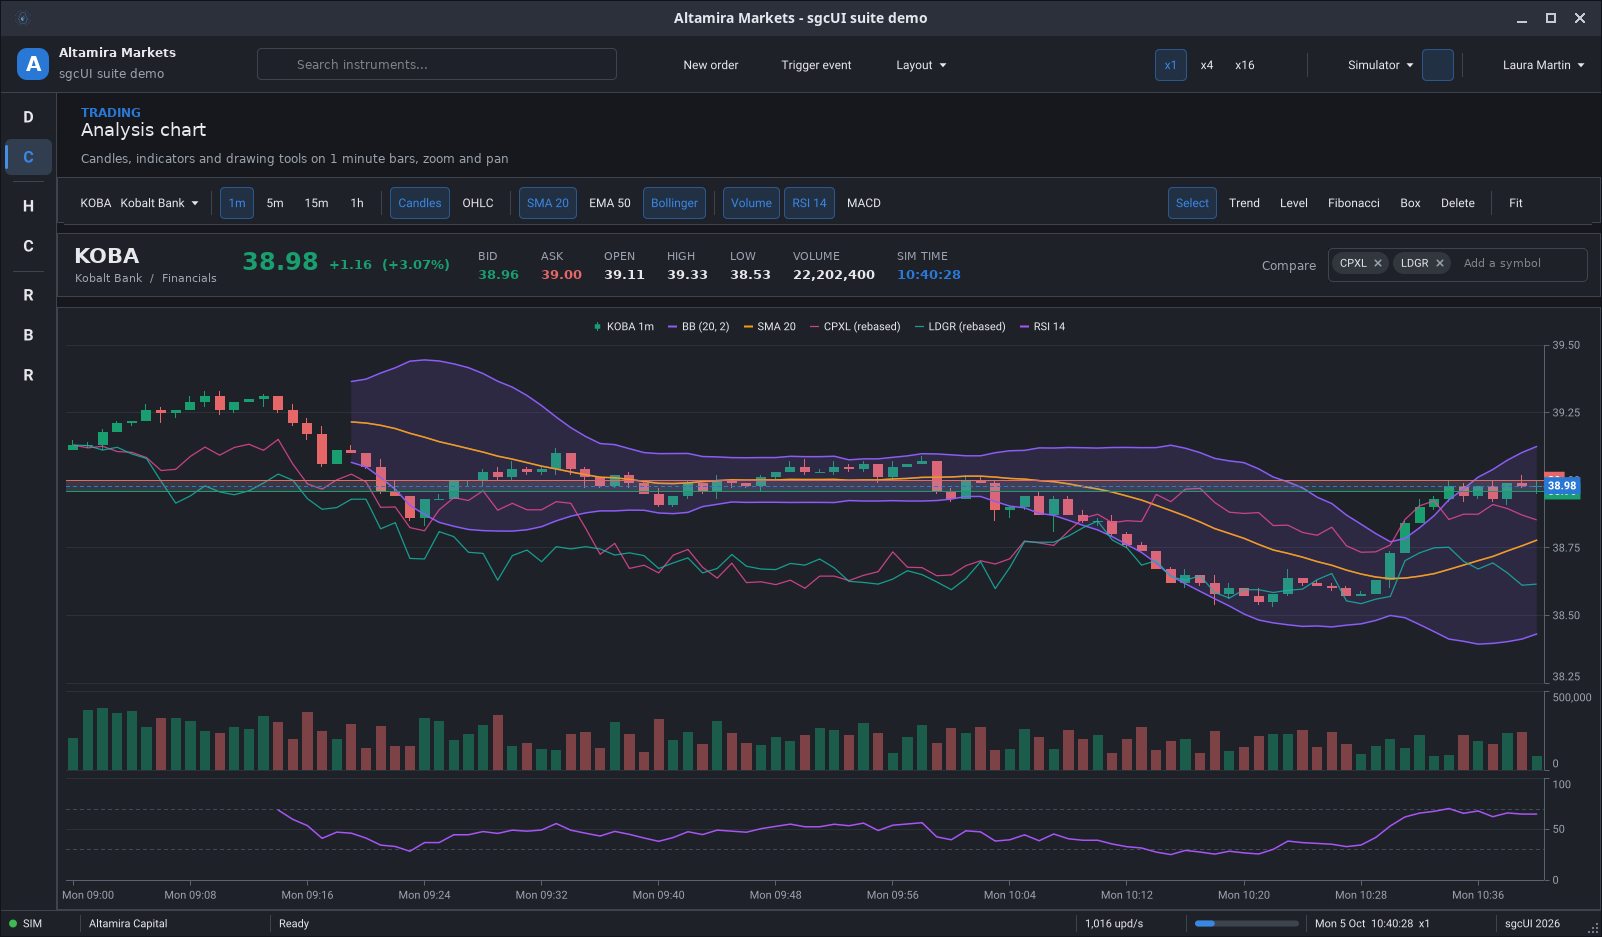
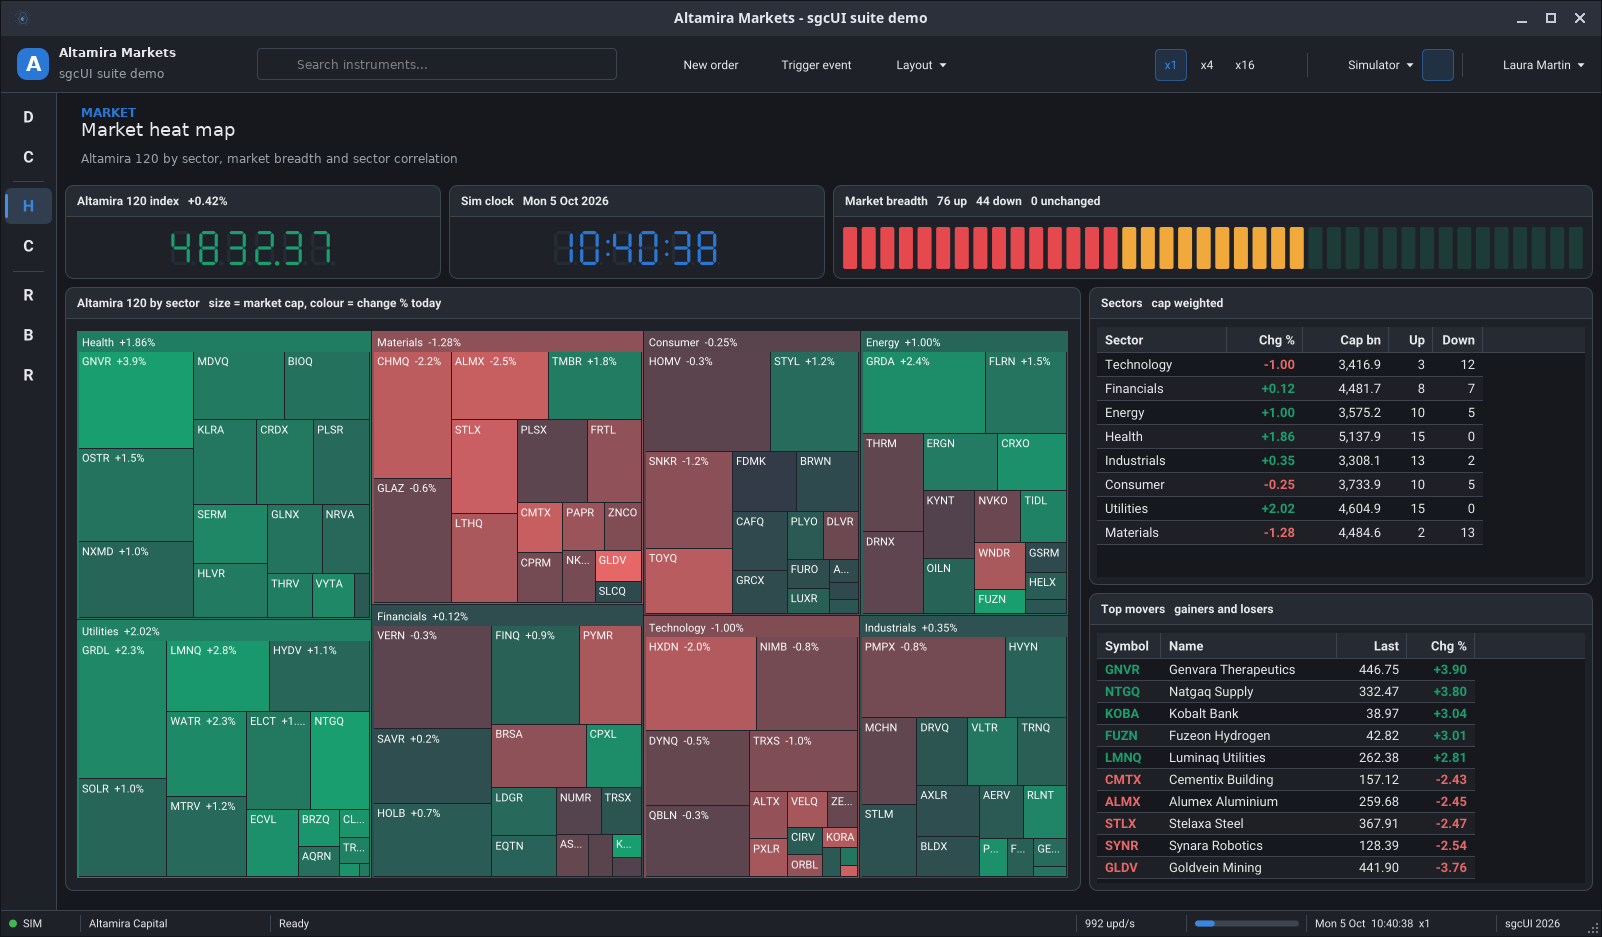
The Markets demo is fed by a simulator that pushes about 1,000 updates per second. The watchlist grid flashes red and green as prices move, the candlestick chart carries Bollinger bands, moving averages, volume and RSI panes, and a sector treemap shows where the market is going.
A Factory Control Room
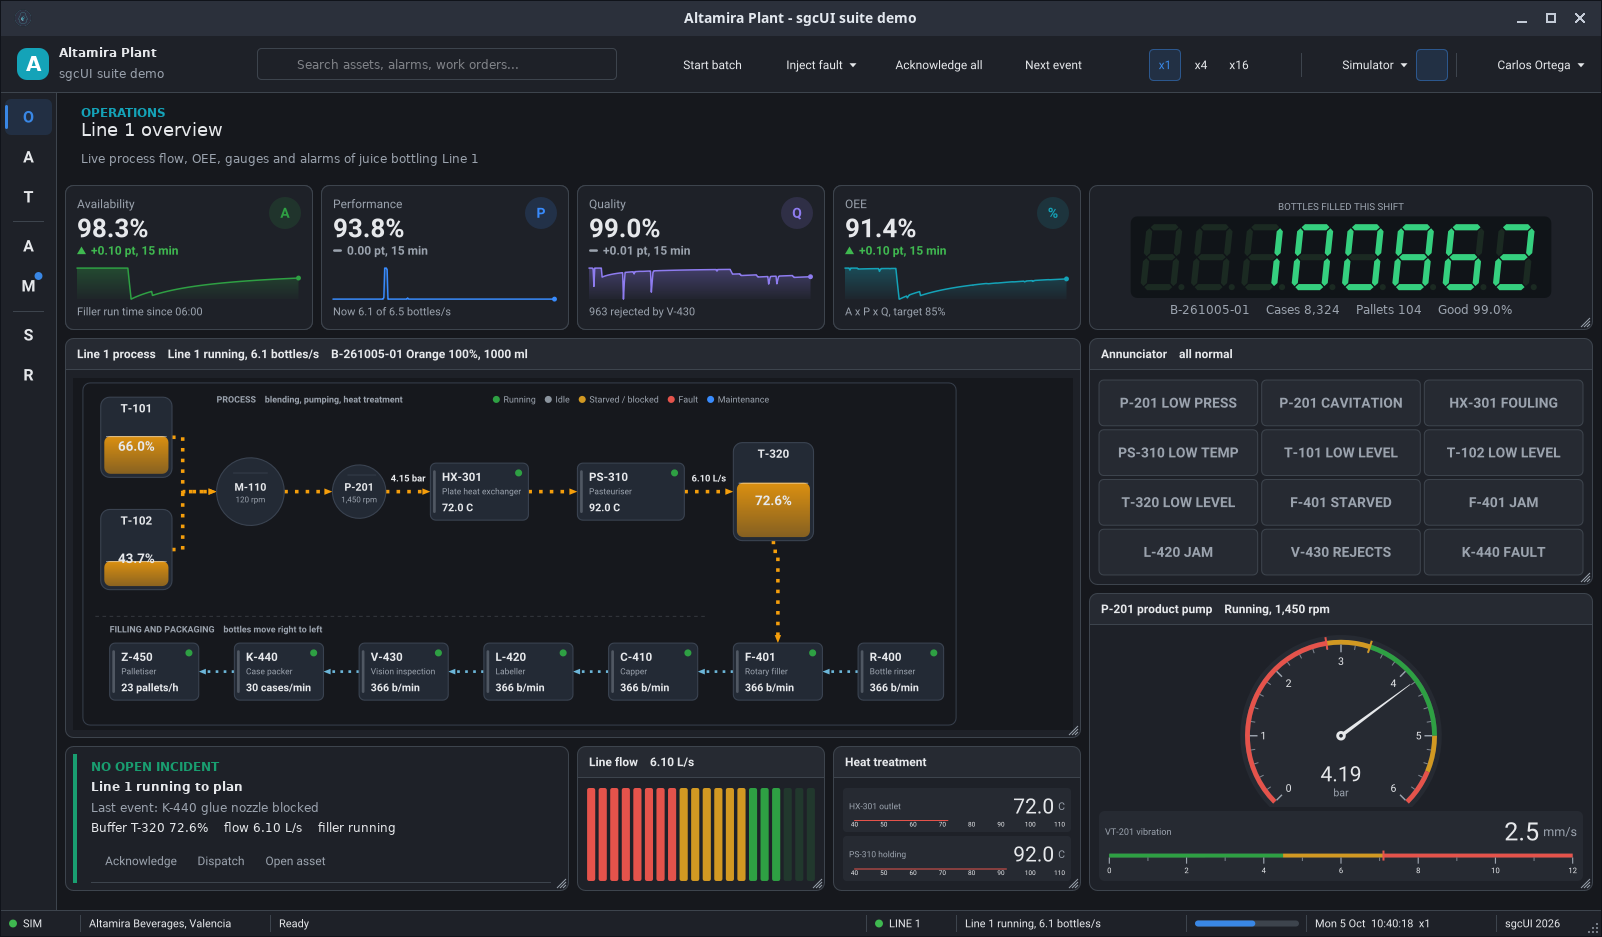
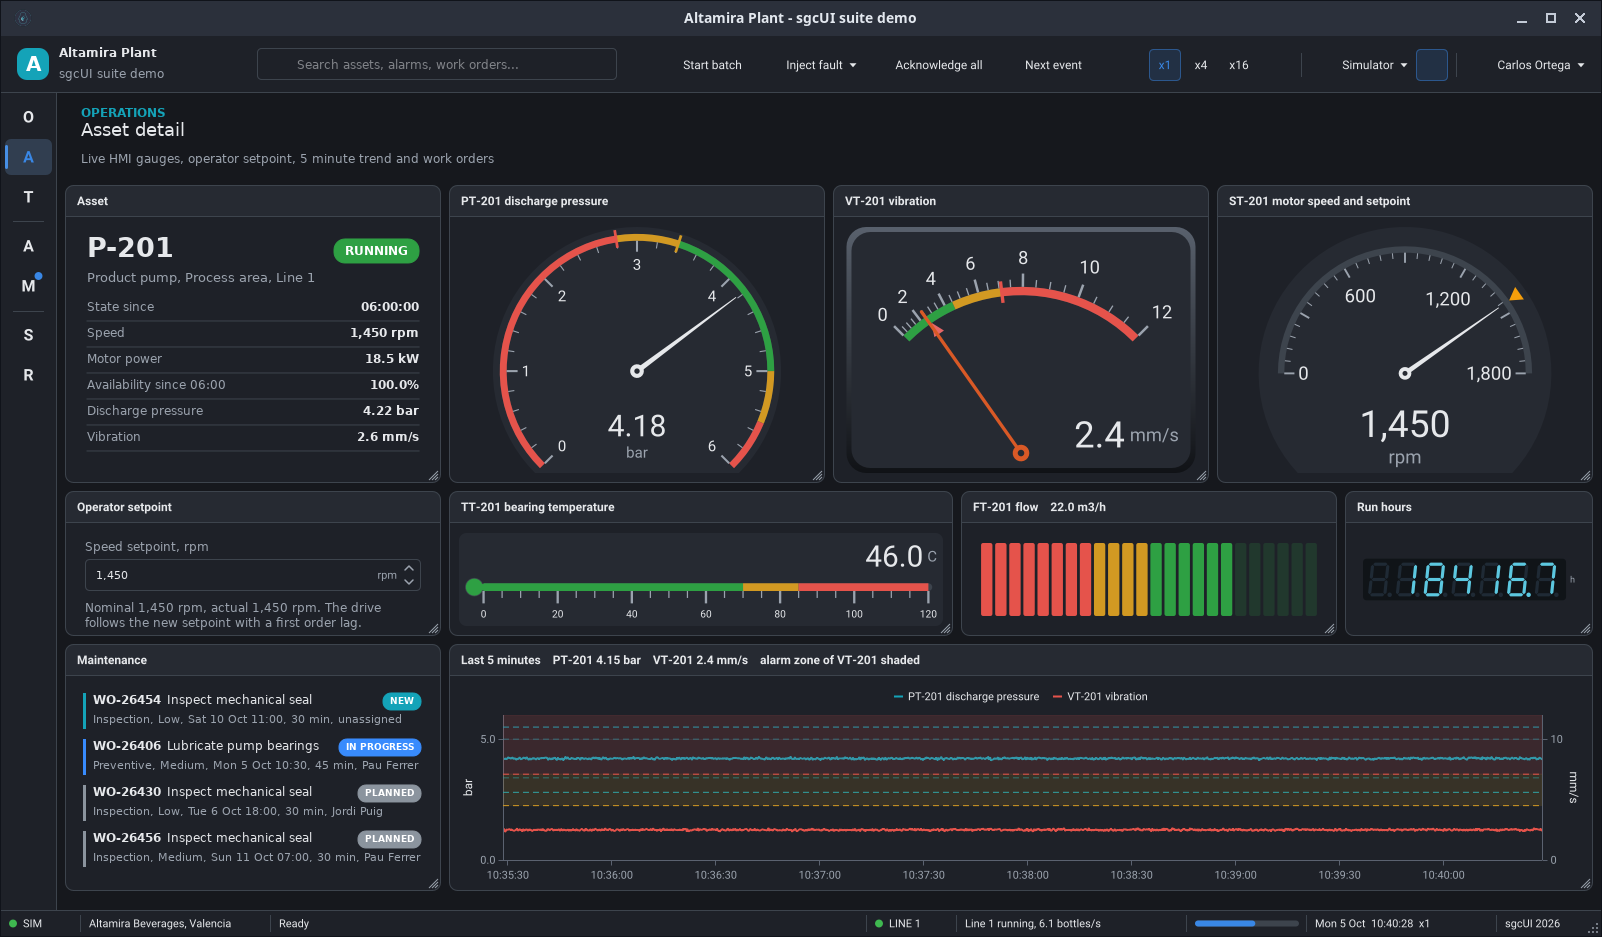
The Factory demo is an HMI for a bottling plant. It shows OEE cards, a seven segment bottle counter, the process flow of the line with animated connectors, an annunciator panel, radial and linear gauges and a live trend of twelve sensors with alarm limits.
Fleet, ERP and Project Portfolio
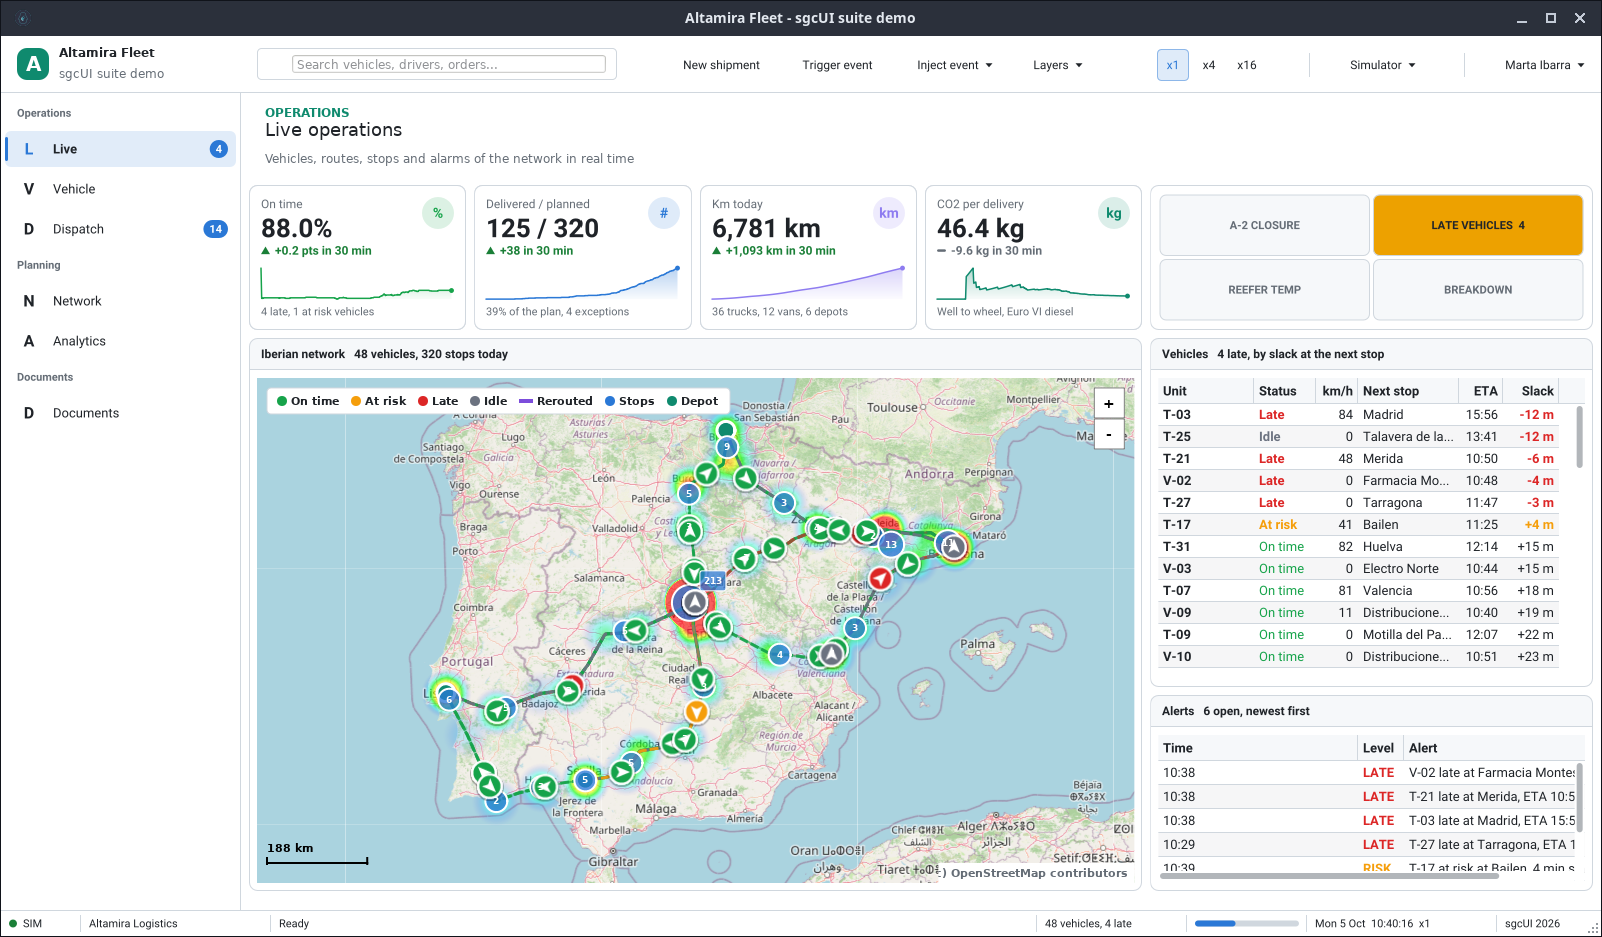
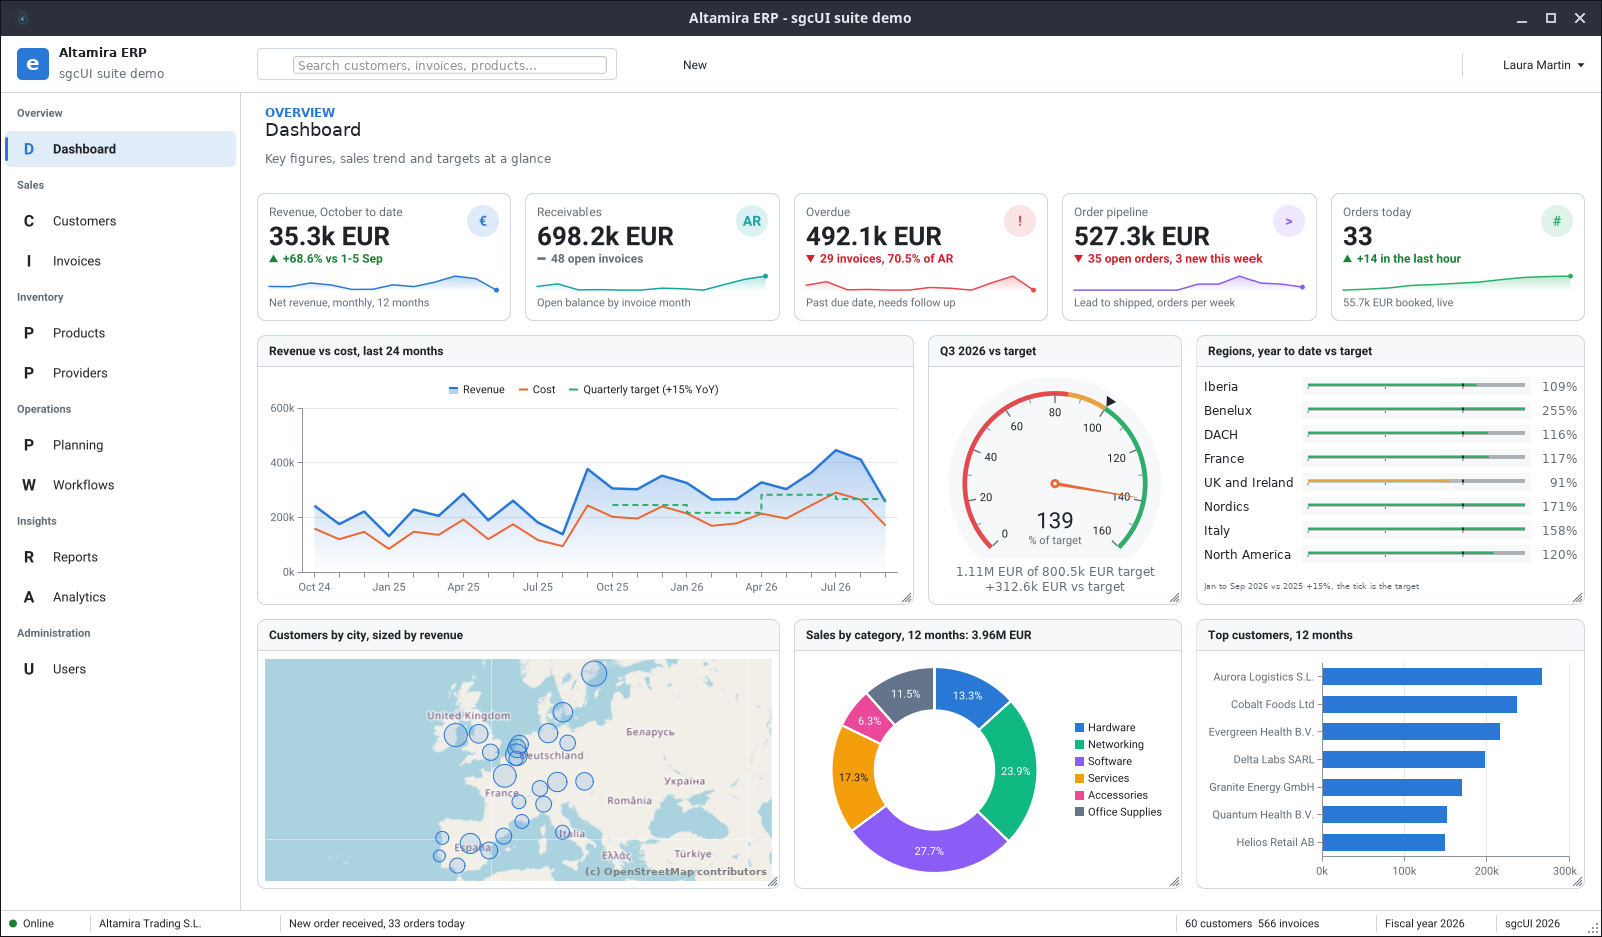
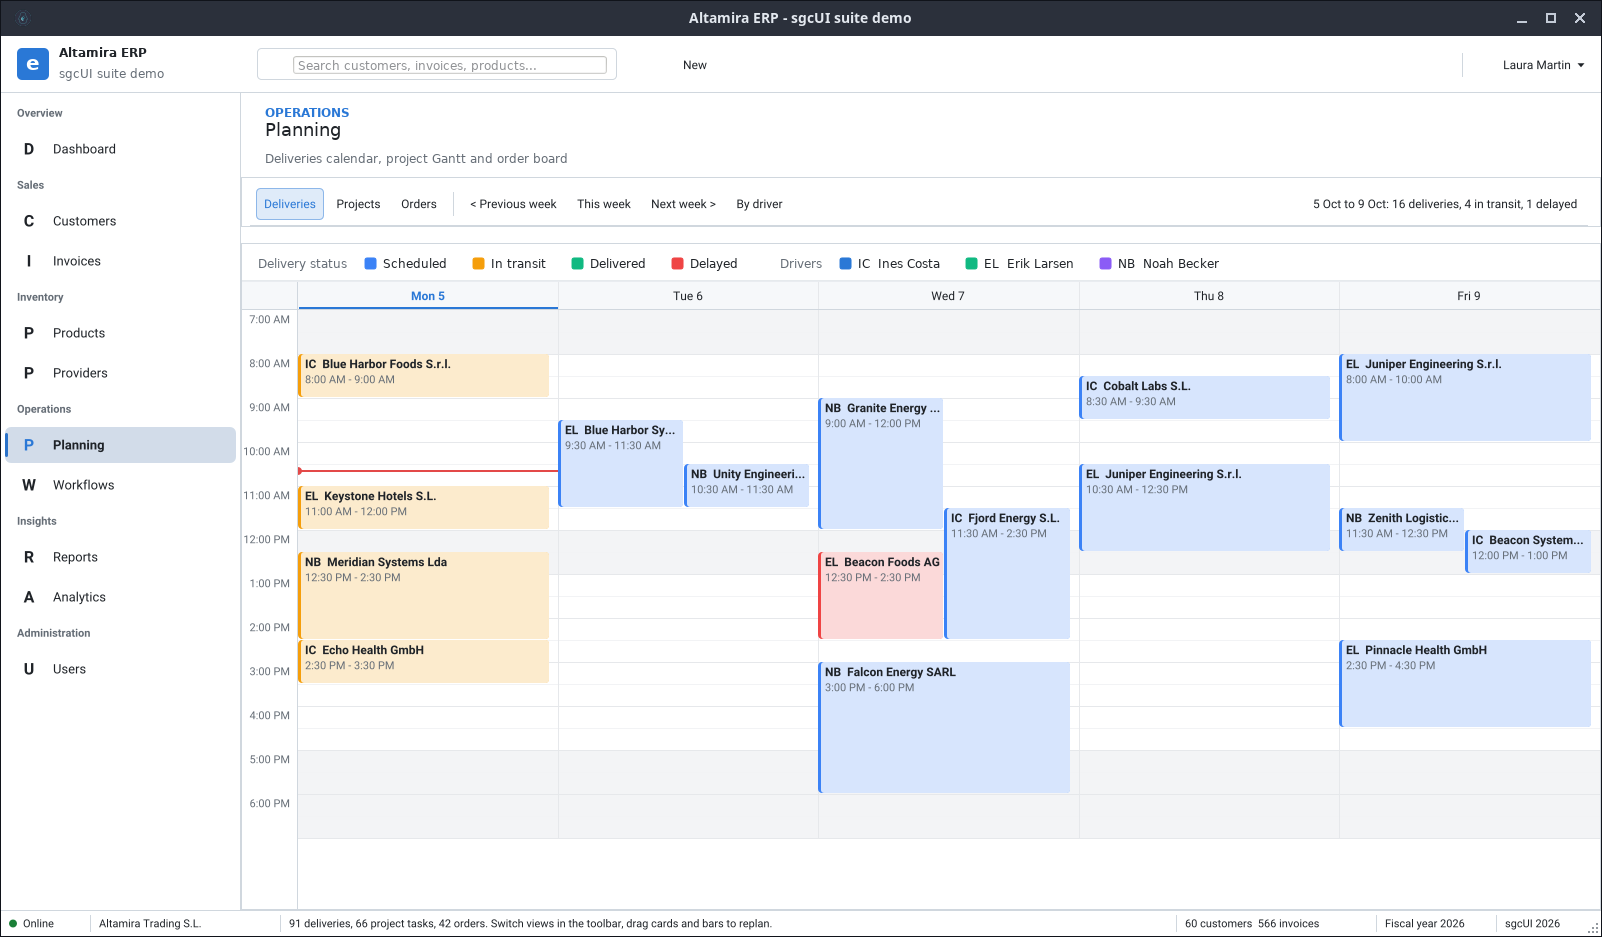
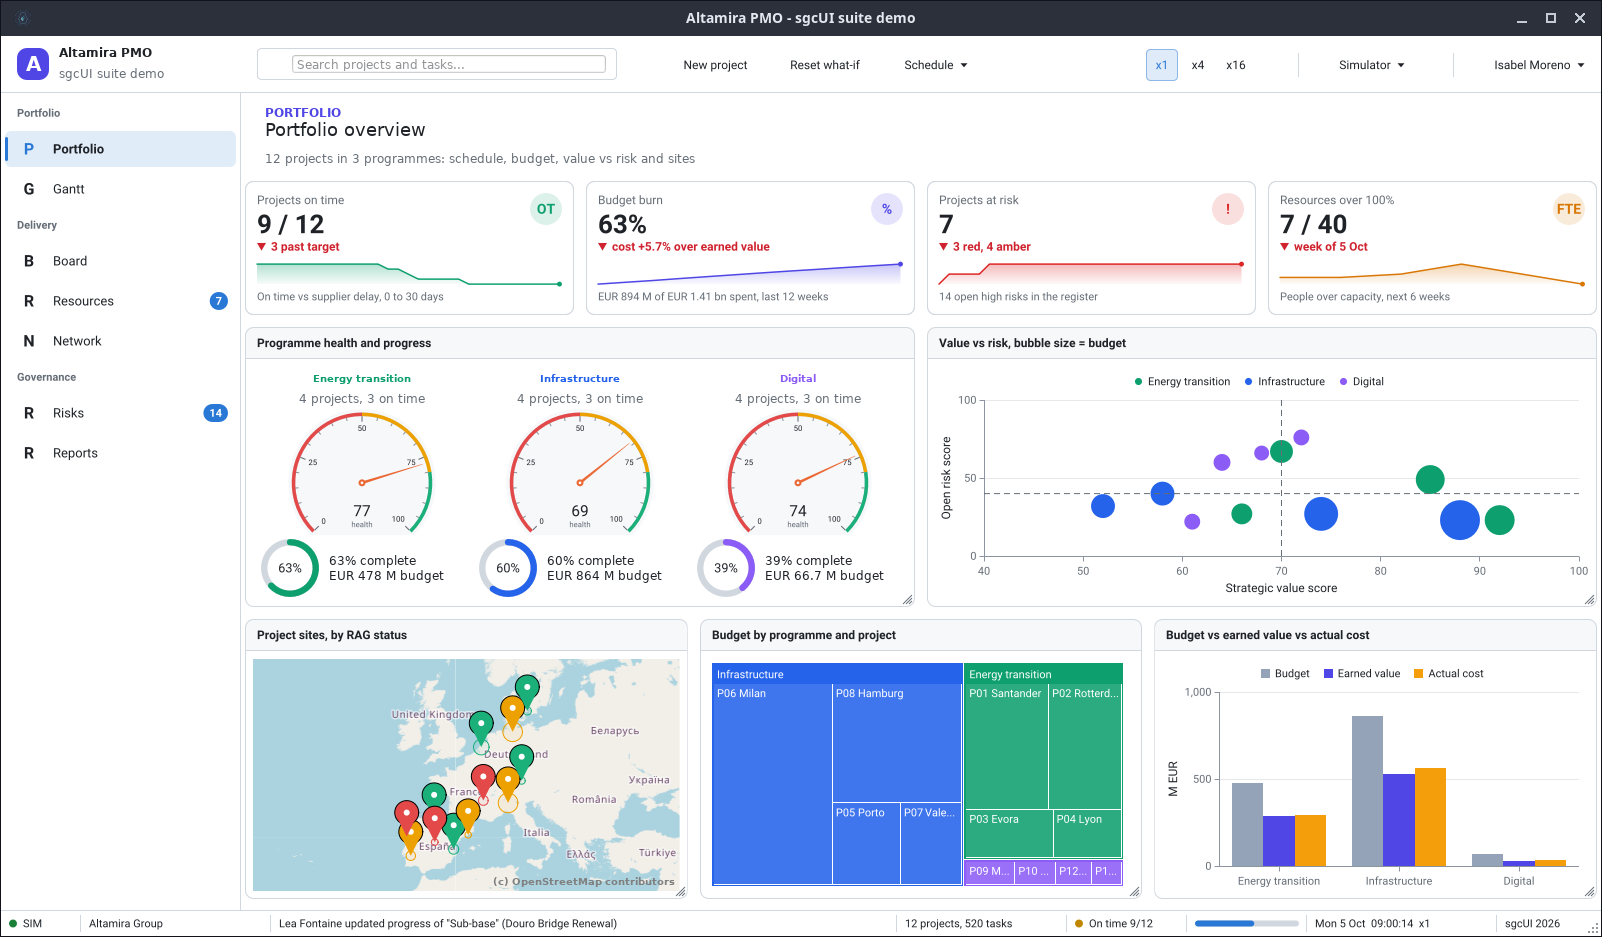
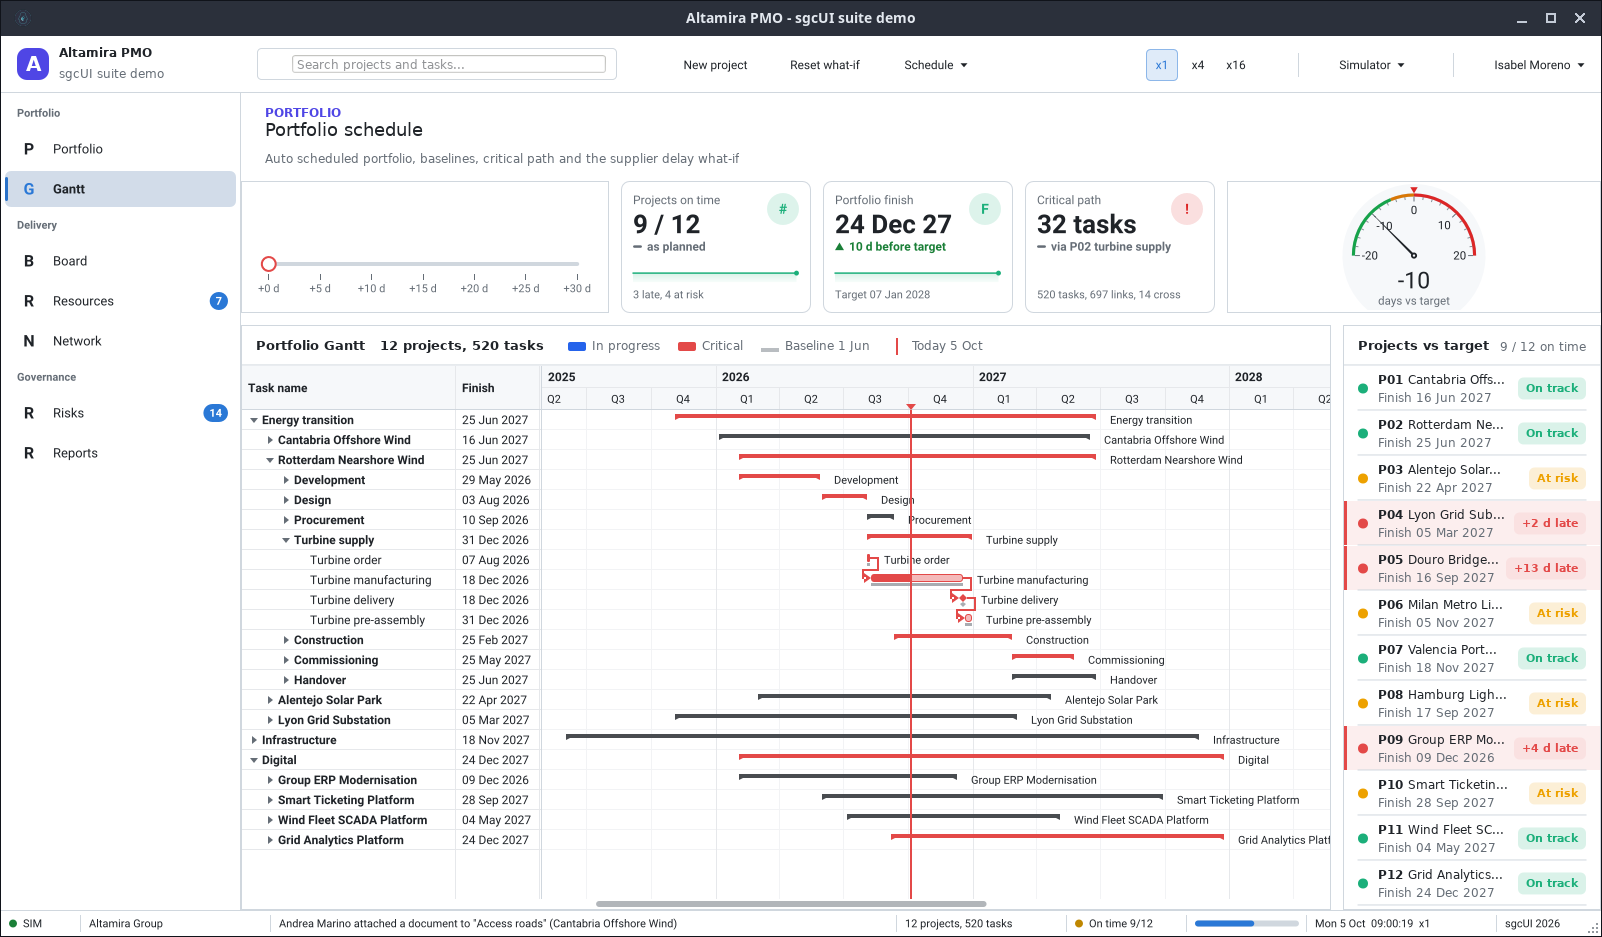
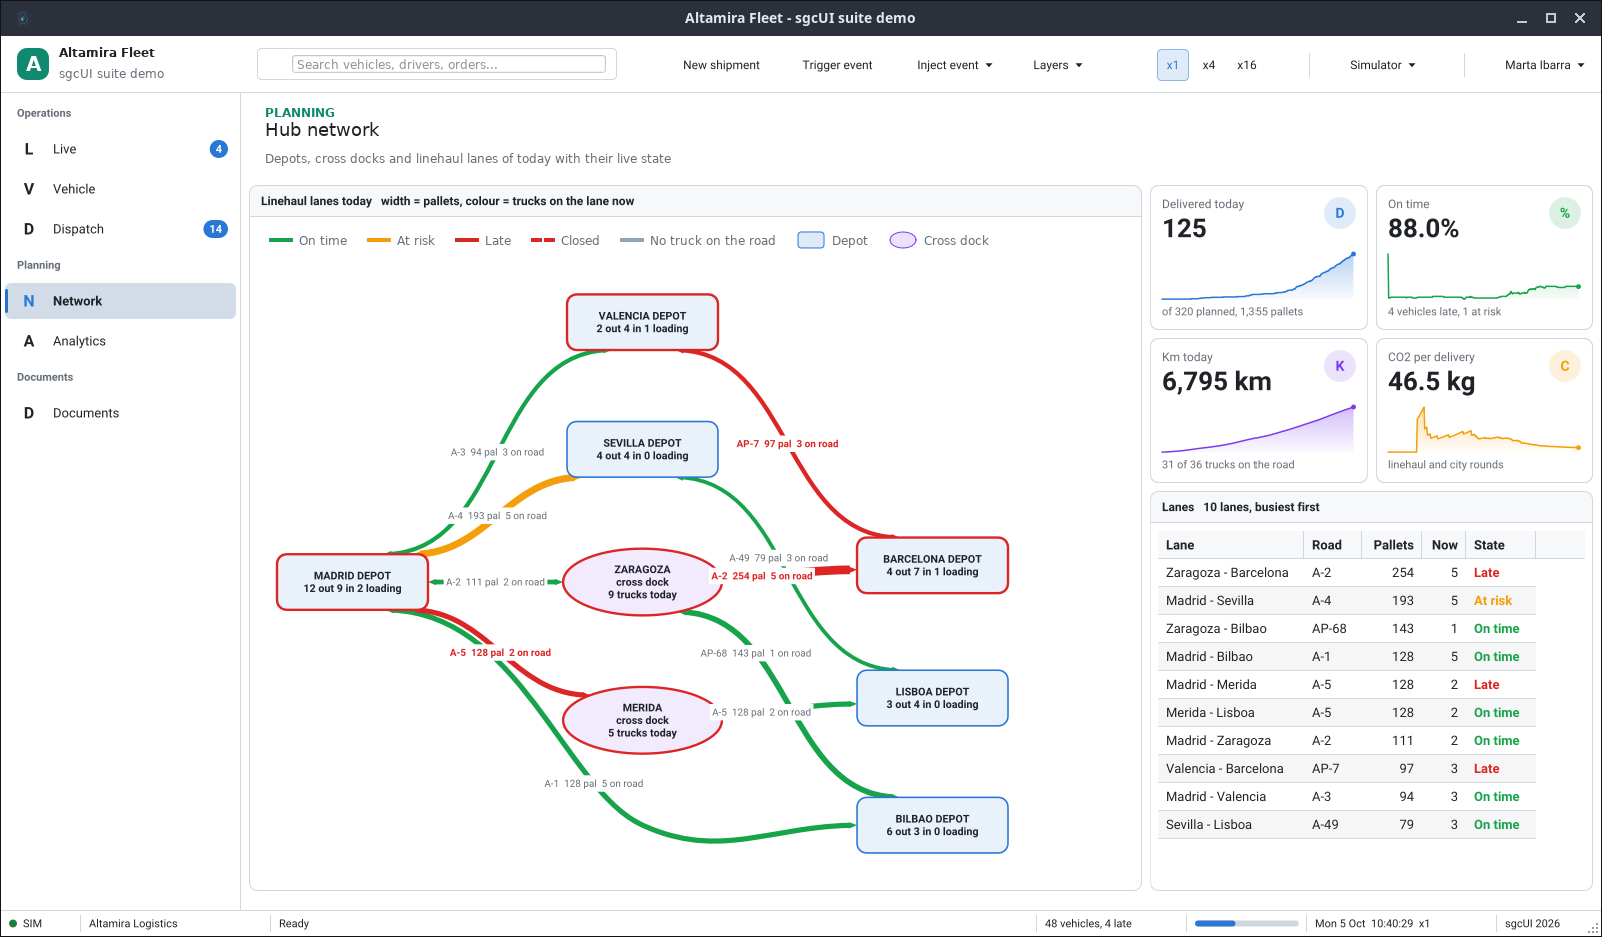
The Fleet demo follows 48 vehicles on a map of Spain and Portugal, with routes, stops, a vehicle grid and an alert list. The ERP demo opens with a dashboard of KPI cards, charts, a gauge and a customer map, and continues with customers, planning, reports and analytics pages. The Portfolio demo schedules 12 projects and 520 tasks in a Gantt chart with the critical path.
What sgcUI Brings to the Linux Desktop
sgcUI is a suite of native UI products that share one core, one theme engine and one way of working. On Linux64 the FireMonkey controls of the whole suite are available:
- sgcGrid: the data grid for live feeds, datasets and large tables, with sorting, grouping, summaries, filter rows, a find panel and Excel export.
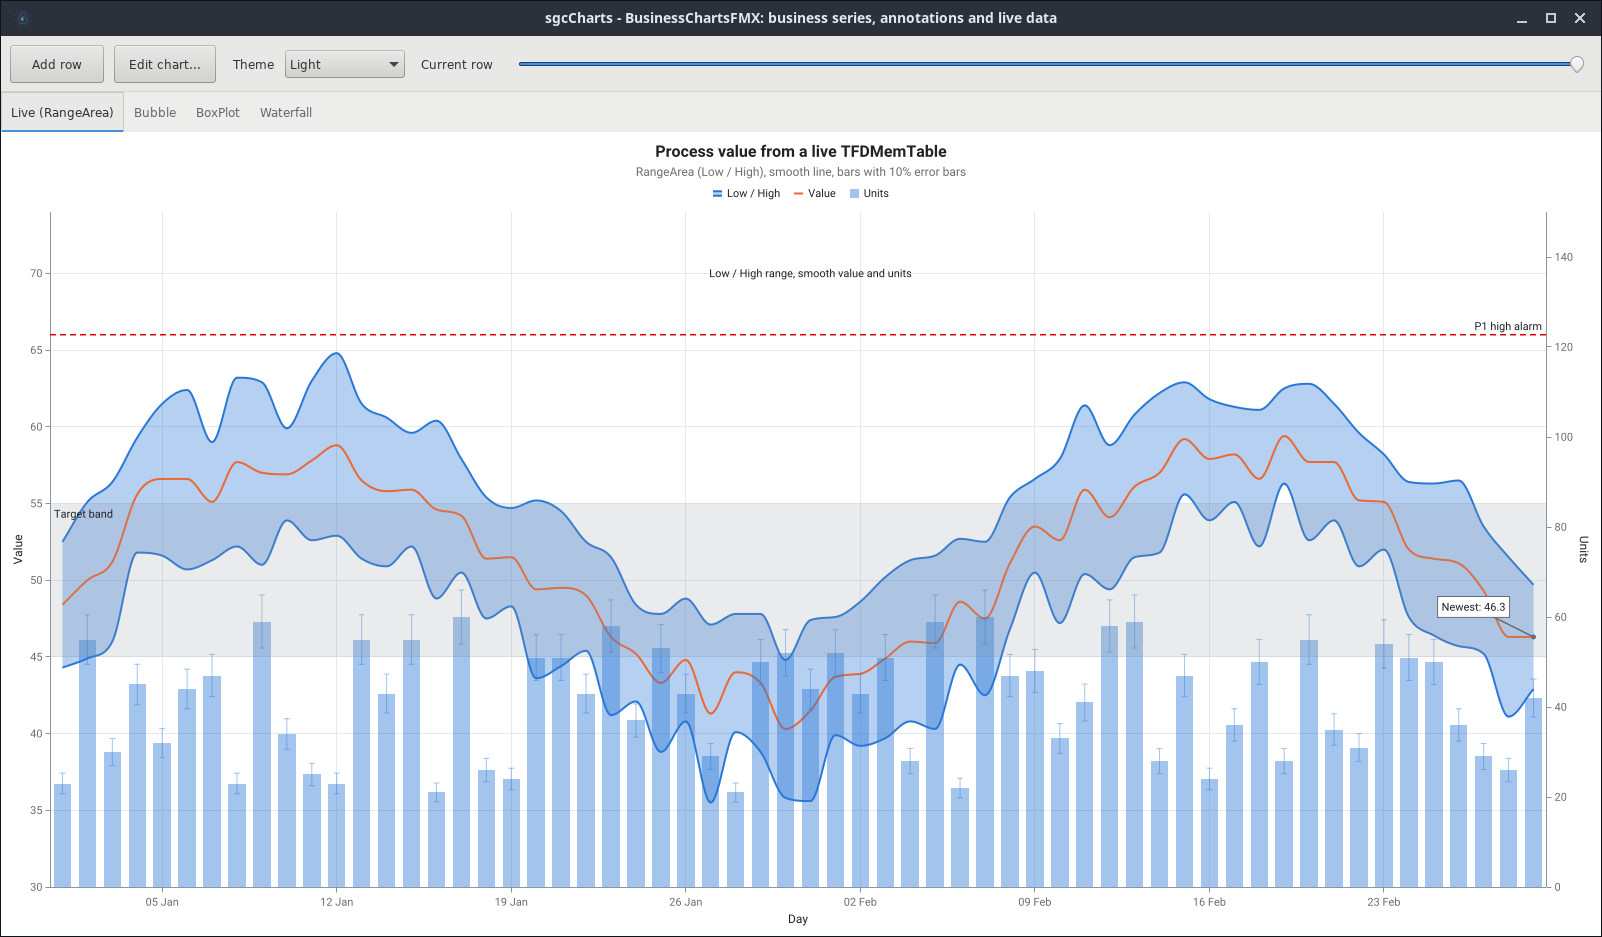
- sgcCharts: twenty-one series types for business charts and live streams, from lines and bars to candlesticks, treemaps and funnels.
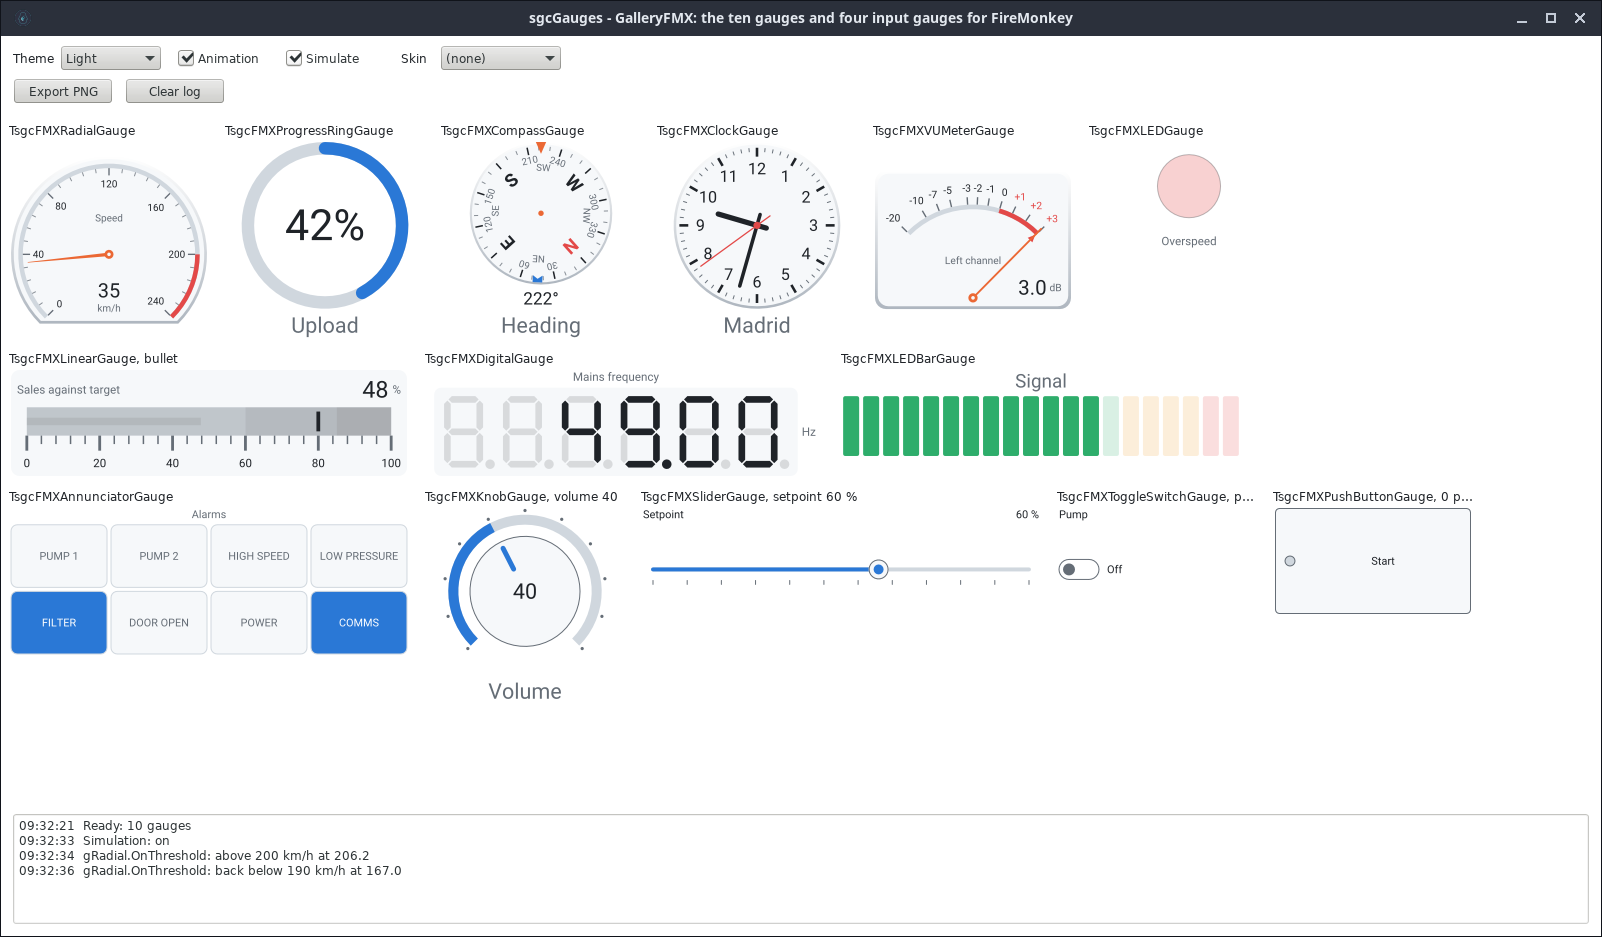
- sgcGauges: fourteen instruments for targets, machines and control rooms.
- sgcDashboard: tiles and KPI cards that turn numbers into a screen.
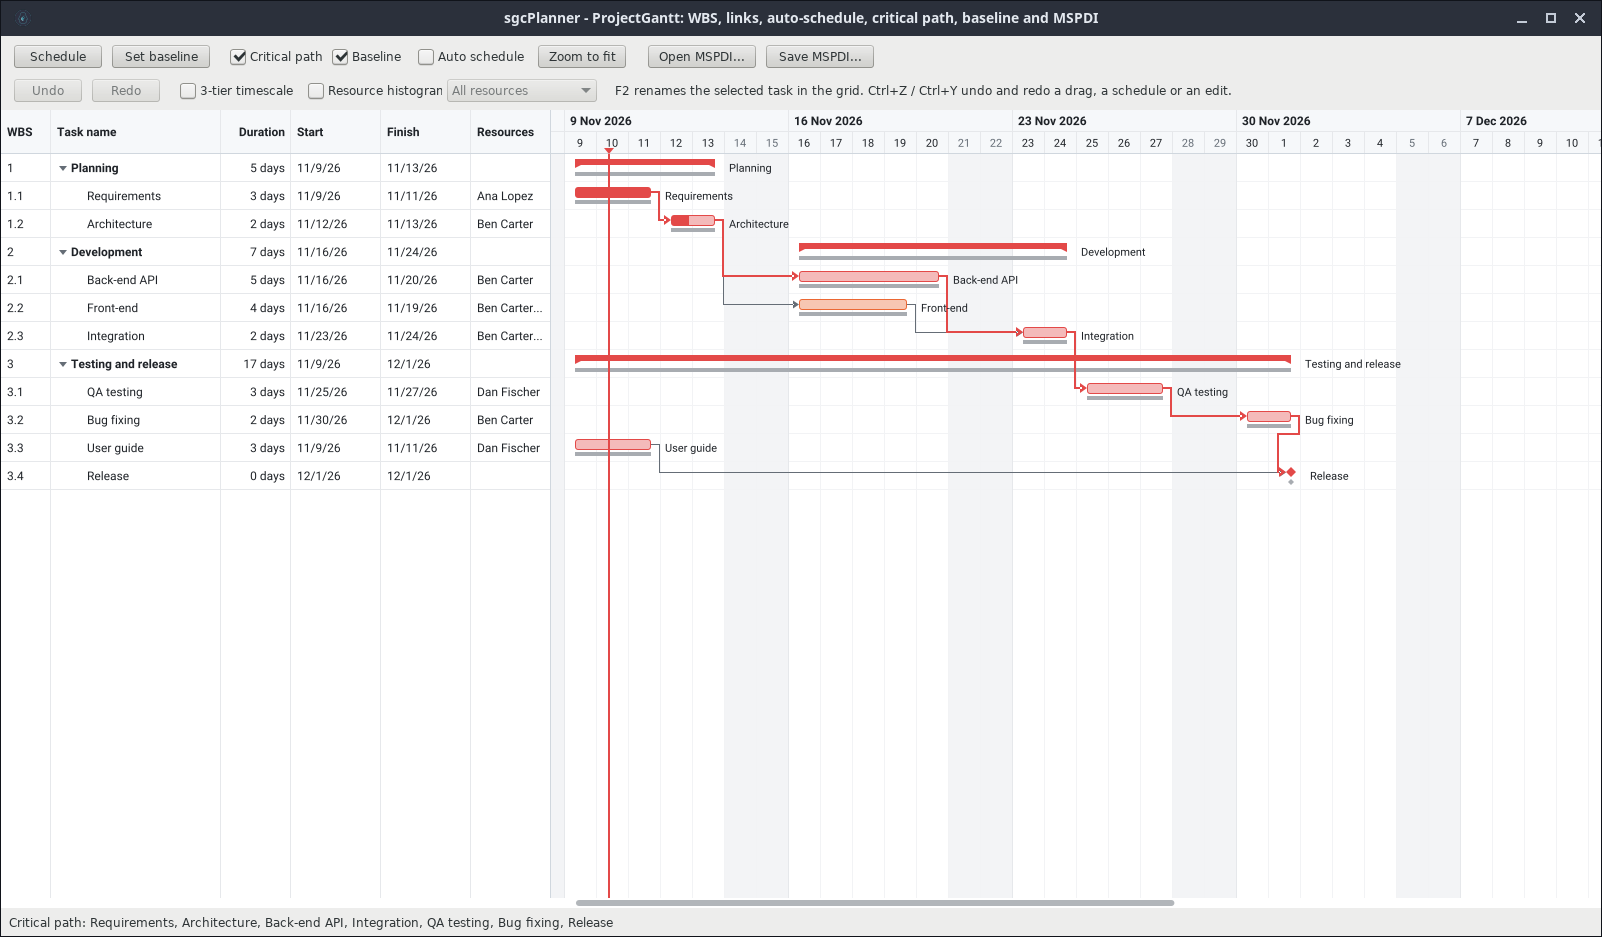
- sgcPlanner: scheduler, Gantt and Kanban on one data model.
- sgcPivotGrid: pivot tables and pivot charts with a field list.
- sgcMaps: native maps with markers, routes and offline tiles.
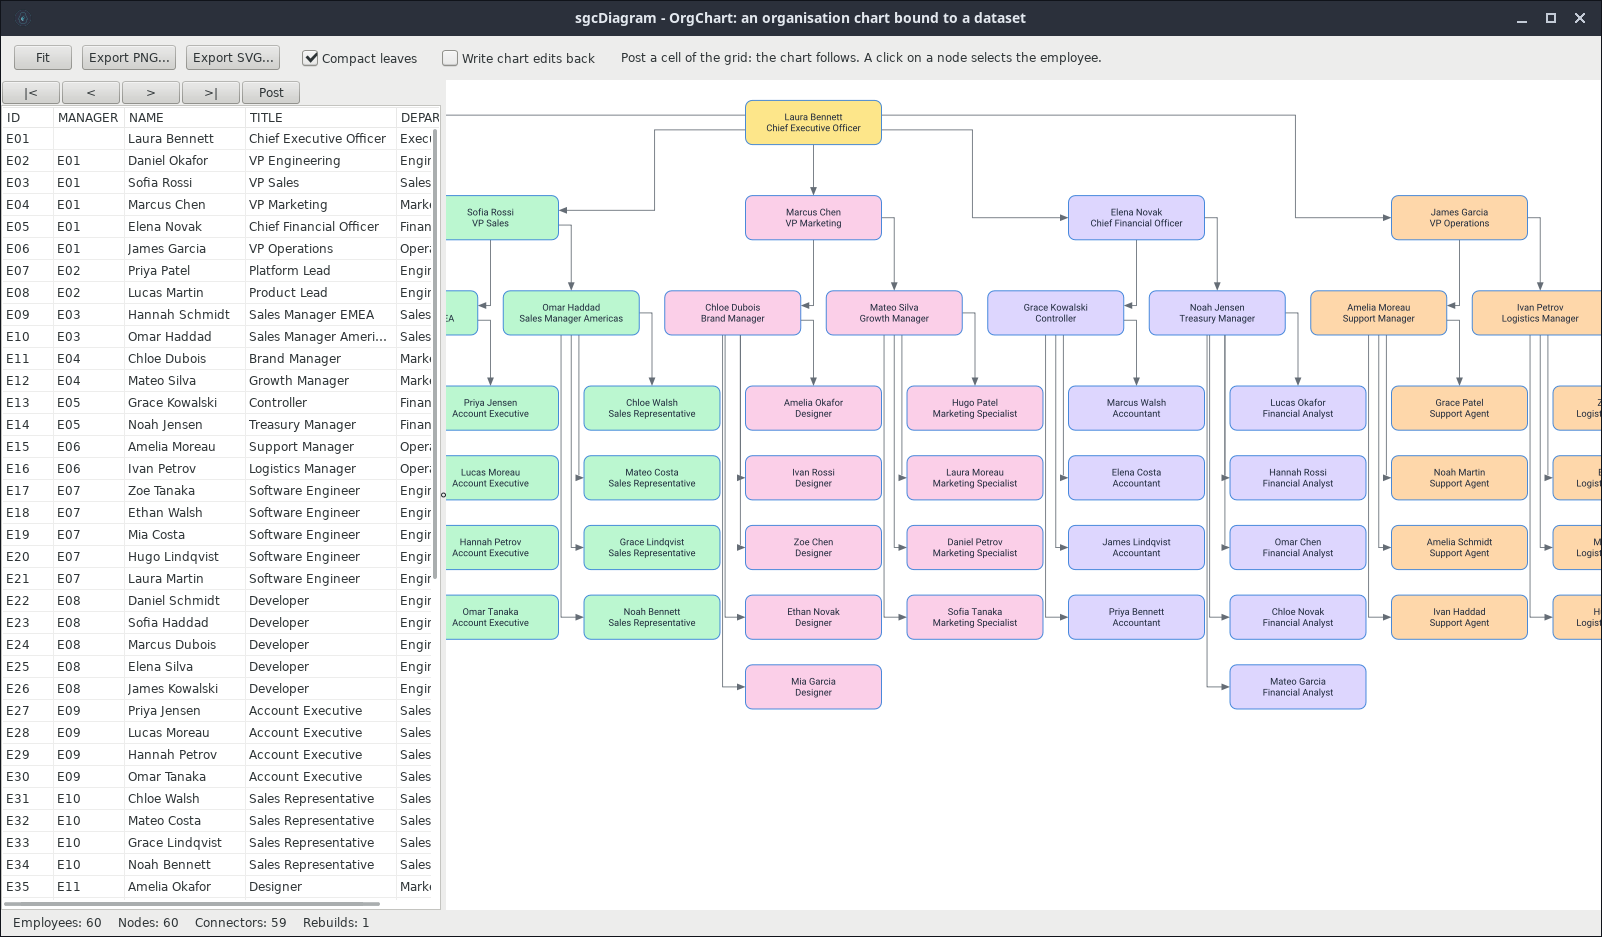
- sgcDiagram: a diagram editor and layouts that draw your data.
- sgcNavigation, sgcToolbar, sgcEditors and sgcWizard: the sidebar, tabs, toolbars, status bars, input controls and multi step forms that hold an application together.
- sgcSpreadsheet, sgcRichEdit, sgcReports, sgcPDF and sgcChat: spreadsheets, rich text, reports, PDF documents and chat inside your application.
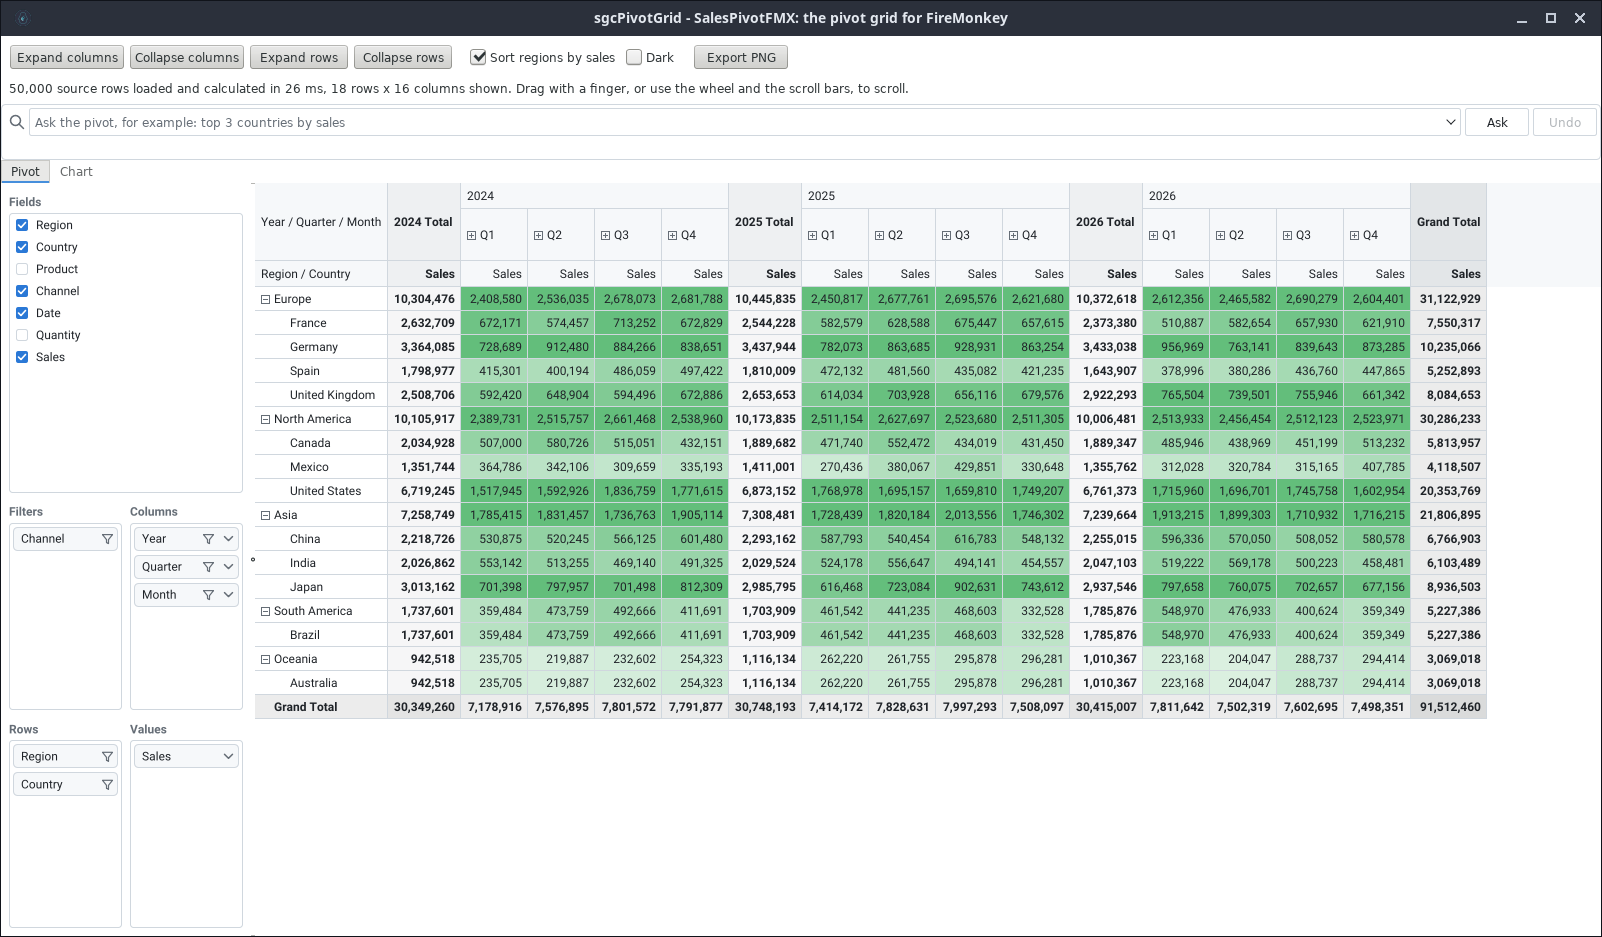
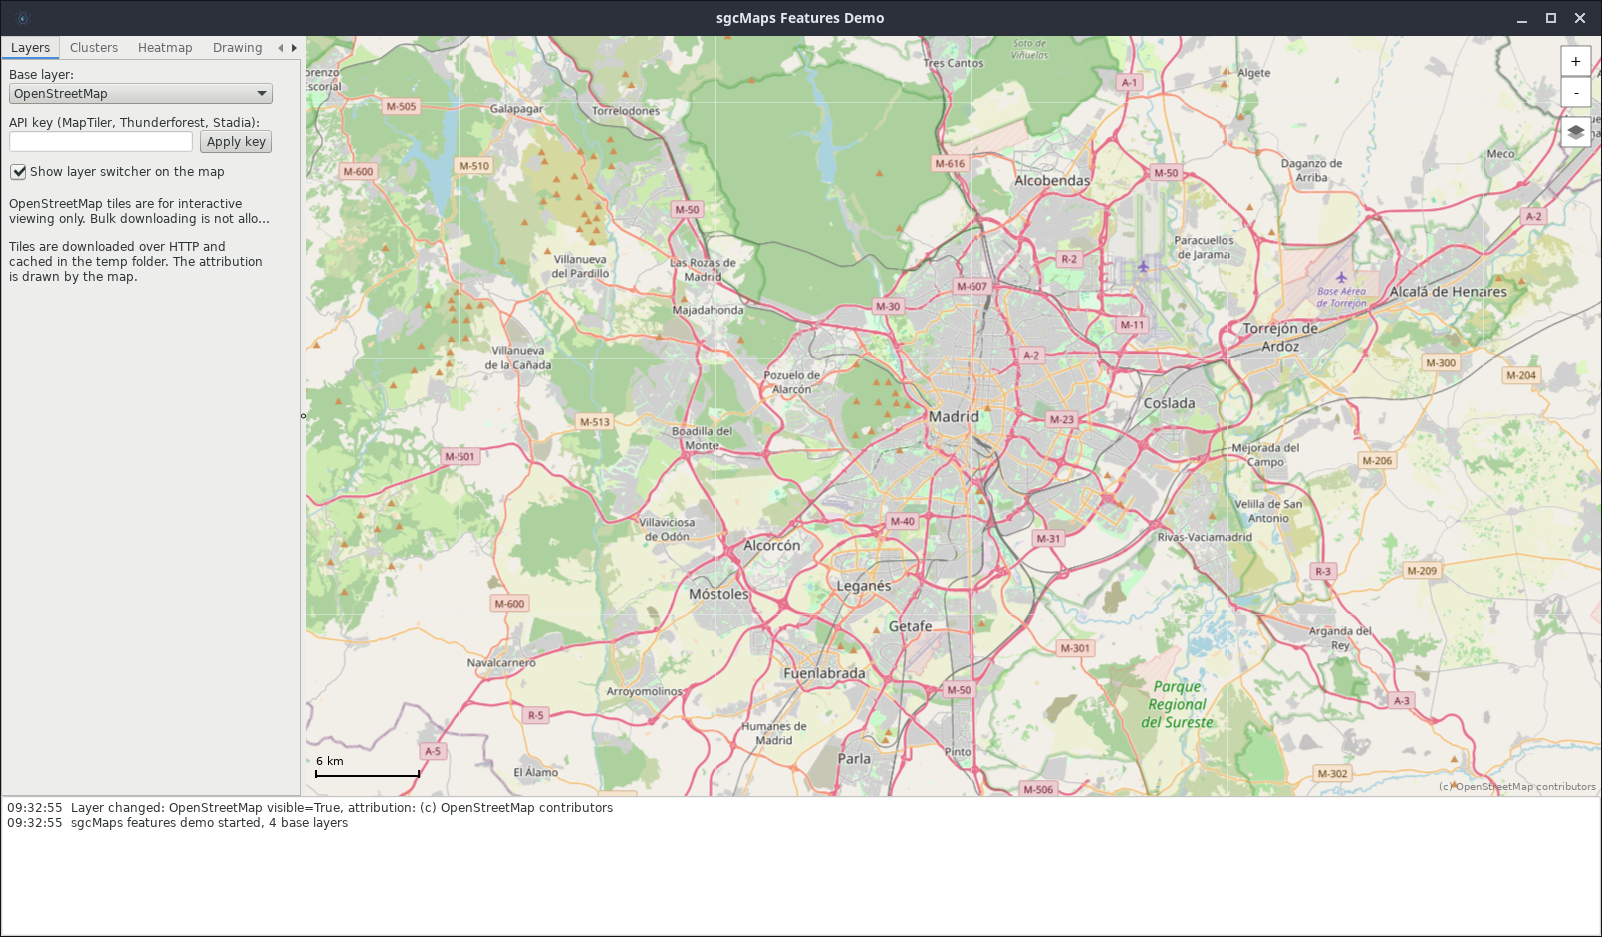
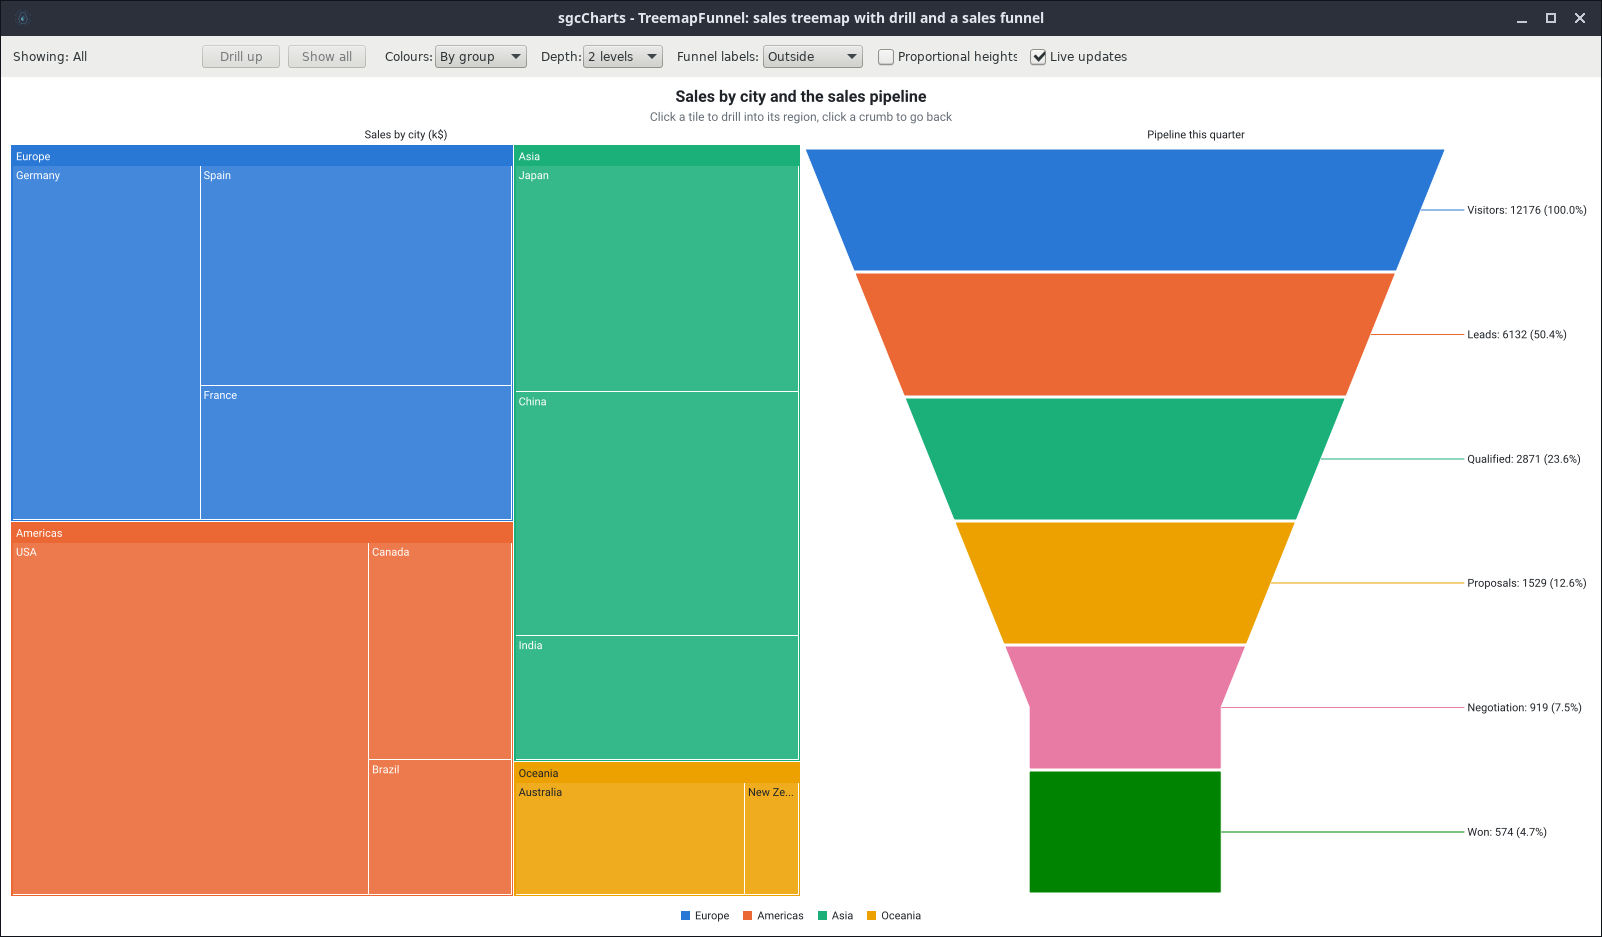
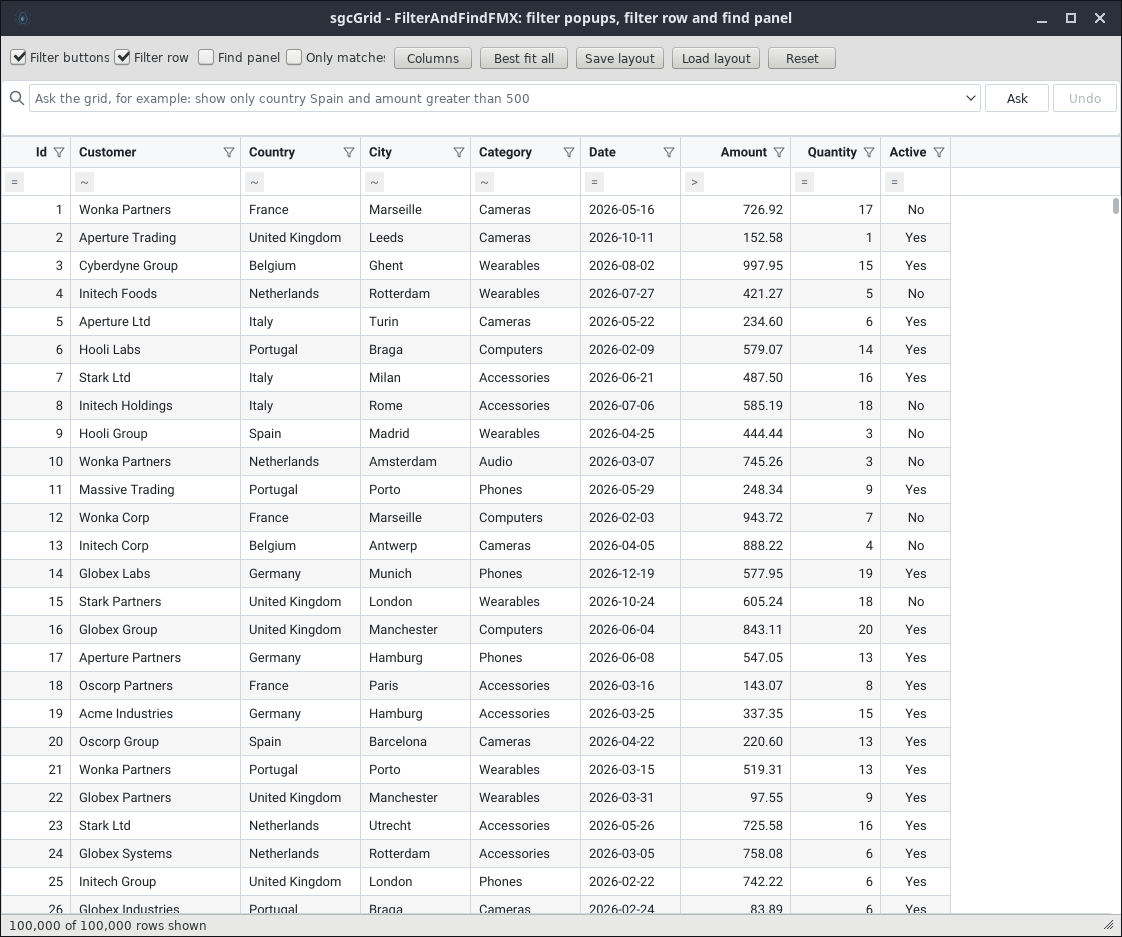
The grid deserves its own picture. This is the FilterAndFind demo with 100,000 rows on Ubuntu, with filter buttons in the headers, a filter row and the “Ask the grid” box. The mouse wheel scrolls it smoothly and Ctrl+End jumps straight to row 100,000.
What You Need
- Delphi 13, Enterprise or Architect, which include the Linux64 compiler.
- The FMXLinux add-on, installed from GetIt. It is available to Enterprise and Architect customers with an active subscription.
- An sgcUI edition with source code. The FireMonkey units are compiled for Linux64 together with your project.
- A Linux machine, real or virtual, with PAServer for building and debugging from the IDE. The applications need glibc 2.34 or later, so Ubuntu 22.04 or later, with GTK3.
sgcUI on Linux64 has been tested with Delphi 13 and FMXLinux 1.84 on Ubuntu 22.04 and Ubuntu 24.04.
Build Your First Linux64 Application
- Install FMXLinux from GetIt and restart the IDE.
- Start PAServer on the Linux machine, create a connection profile in the IDE and import the Linux SDK, as for any Delphi Linux64 project.
- Add the sgcUI
Sourcefolder to the Linux 64-bit library path (Tools, Options, Language, Delphi, Library), so the compiler finds the sgcUI units for that platform. - Open or create a FireMonkey application, add the Linux 64-bit target platform in the Projects window and select it.
- Drop the sgcUI controls on the form and run. The IDE compiles the project, deploys it through PAServer and starts it on the Linux desktop.
There is no Linux specific code to write. This is the complete source of the Hello Grid quick start, a form with one TsgcFMXGrid whose three columns are defined in the designer:
uses
  System.SysUtils, System.Classes, FMX.Types, FMX.Controls, FMX.Forms,
  // sgc
  sgcGrid_Data, sgcGrid_FMX;

procedure TfrmHelloGrid.FormCreate(Sender: TObject);
begin
  { BeginUpdate / EndUpdate repaint the grid once, after the last row }
  Grid.Data.BeginUpdate;
  try
    { AppendRow(Key, [City, Country, Population]) }
    Grid.Data.AppendRow('Madrid', ['Madrid', 'Spain', 3416771]);
    Grid.Data.AppendRow('Paris', ['Paris', 'France', 2102650]);
    Grid.Data.AppendRow('Berlin', ['Berlin', 'Germany', 3755251]);
    Grid.Data.AppendRow('Rome', ['Rome', 'Italy', 2749031]);
  finally
    Grid.Data.EndUpdate;
  end;
end;
A chart works the same way. A TsgcFMXChart control paints a TsgcChart component, and each series is a component too, here a TsgcChartSeries_Line. The only code adds the points:
uses
  // sgc
  sgcCharts_Chart, sgcCharts_Series, sgcCharts_FMX;

const
  CS_VISITS: array [0 .. 6] of Integer = (420, 515, 480, 610, 590, 380, 350);

procedure TfrmHelloChart.FormCreate(Sender: TObject);
var
  i: Integer;
begin
  { X is the day, Y the visitors. The chart repaints by itself }
  for i := Low(CS_VISITS) to High(CS_VISITS) do
    serVisits.AddXY(i + 1, CS_VISITS[i]);
end;
Select Windows, macOS or Linux 64-bit in the Projects window and the same two forms run on each of them.
From a Form to an Advanced Application
The Suite demos above are built with the same pieces, and their source code ships with sgcUI. These are the ideas that make a large Linux64 application manageable:
- Start from a Suite demo. ERP, Factory, Fleet, Markets and Portfolio are complete applications with navigation, pages, themes and a data simulator. Pick the one closest to your project and replace the simulator with your data.
- Design in the form designer. The demo screens live in the
.fmxfiles, not in code, so what you see in the IDE on Windows is what runs on Linux. - Keep the data in the models. Every sgcUI control paints a framework neutral model: the grid data, the chart, the planner data, the diagram document. Your business code talks to the model, so it does not depend on the platform or on the UI framework.
- Batch your updates. For live screens, wrap bursts of changes in
BeginUpdateandEndUpdate, so the control paints once per burst and not once per value. - Use one theme for everything. The controls follow the light or dark theme of the application, so a dark control room screen like the Factory demo needs no styling per control.
- Render on the server too. The same models render grids, charts, gauges and dashboards to PNG and SVG with no window. A Linux64 service can build the images for reports, e-mails and web endpoints, and this part needs no add-on.
- Test on the distribution you deploy to. Fonts and window managers differ between Linux desktops, so check the final screens on the target system.
Try It Now: 274 Compiled Linux64 Demos
You do not need Delphi, FMXLinux or a licence to see sgcUI running on Linux. The FireMonkey demos of every product, 274 programs in total, are compiled for Linux64 and packed in one archive:
Download sgcUI_bin_linux64.tar.xz
tar -xJf sgcUI_bin_linux64.tar.xz
./run.sh              # choose a demo from the list
./run.sh Charts       # only the demos of one product

# or start one demo directly
cd Grid/FilterAndFind
GDK_BACKEND=x11 ./FilterAndFindFMX
The demos run on Ubuntu 22.04 or later and on other distributions with glibc 2.34 or later and GTK3, on an X11 or XWayland display. The demos with online maps also need libcurl and an Internet connection. The README.txt in the archive has the details.
One Code Base, Every Desktop
Windows, macOS and now Linux64, with the same FireMonkey forms and the same sgcUI controls. Download the compiled demos and see them run on your own Linux desktop.
Questions or feedback? Get in touch, you will get a reply from the people who wrote the code.