sgcUI sgcPivotGrid is available right now

sgcPivotGrid. Raw rows in. Answers out.

Drop fields into rows, columns and values, group dates by year, quarter or month, and let users build their own layout with a drag and drop field list. A native pivot table grid for Delphi, C++ Builder and .NET, with source code included.

  • VCL
  • FireMonkey
  • WinForms
  • WPF
  • Avalonia
  • Delphi 7 to 13
  • 100 msto recalculate 1,000,000 rows, Win64 QA budget
  • 900 msto append 1,000,000 rows, Win64 QA budget
  • 8aggregations, including distinct count, StdDev and Var
  • 5UI frameworks: VCL, FireMonkey, WinForms, WPF, Avalonia

Everything a pivot table needs.

Large row sets to summarise, users who want their own view, numbers that must be checked and handed on. sgcPivotGrid covers all of it in one control, on every framework.

  • Pivot grid and field list

    A pivot grid plus a drag and drop field list for VCL, FireMonkey and .NET.

  • Built for volume

    Typed column store and one pass per recalculation, budgeted for a million rows.

  • Any data source

    A TDataSet, an sgcGrid table, a .NET DataTable or rows appended from code.

  • Export and render

    CSV, JSON, HTML, PNG and SVG, also headless on a server or Linux64.

See it run.

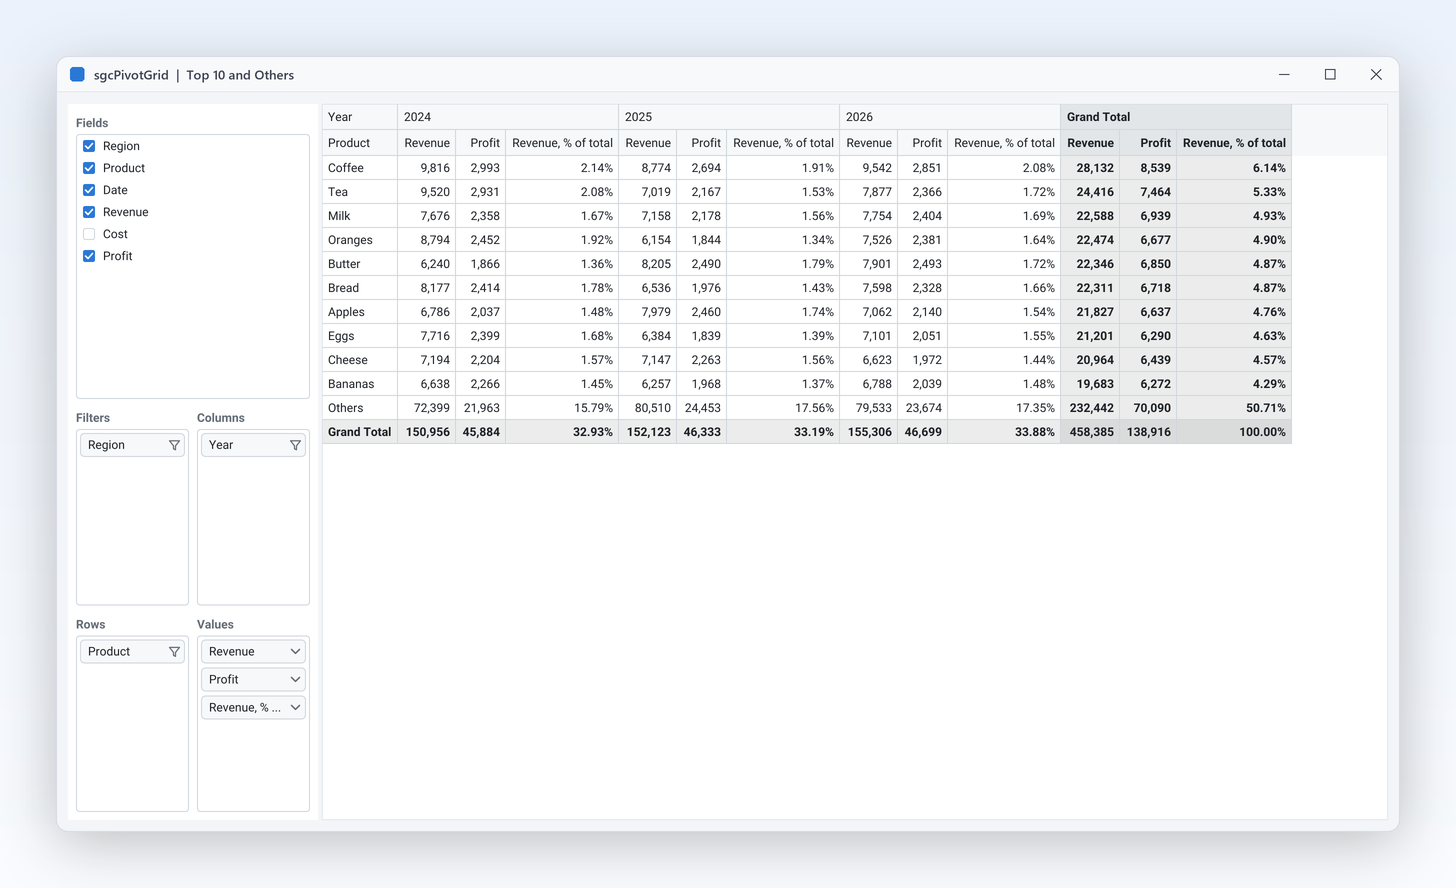
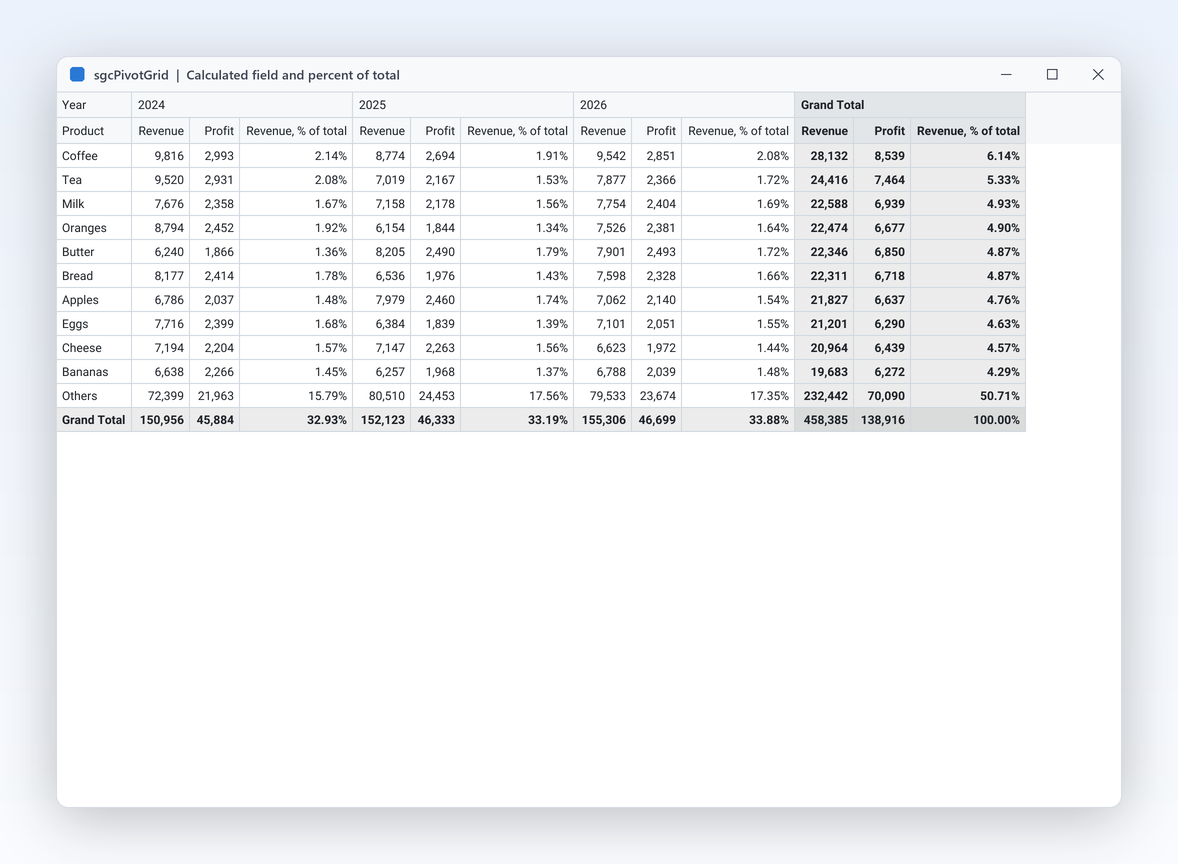
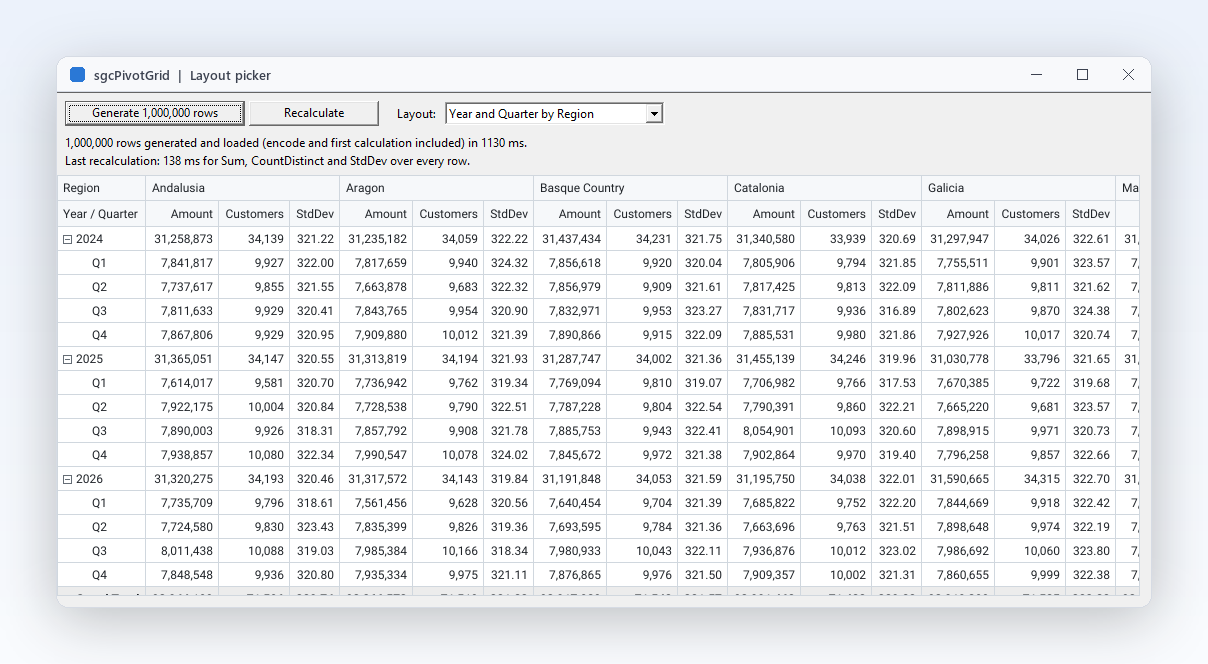
Captured from the sgcPivotGrid demos that ship with the trial.

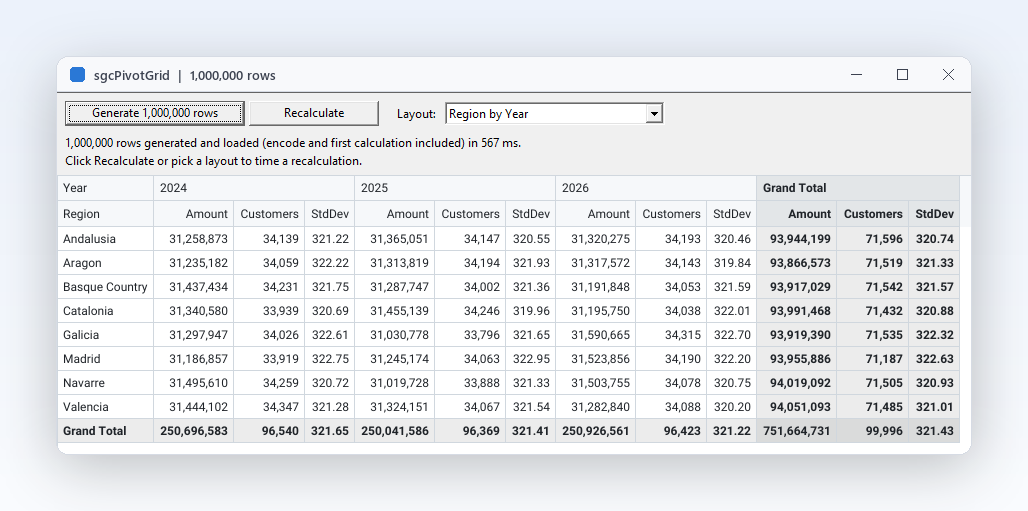
MillionRows demo after pivoting 1,000,000 rows, with the timing label it prints
Speed and data

Pivot a million rows in a fraction of a second.

  • Every column sits in a typed column store, and the cells are aggregated in one pass over the source rows.
  • BeginLoad, DefineColumn, AppendRow and EndLoad load the rows with one recalculation at the end.
  • The MillionRows demo loads and pivots 1,000,000 rows and prints its own timing.
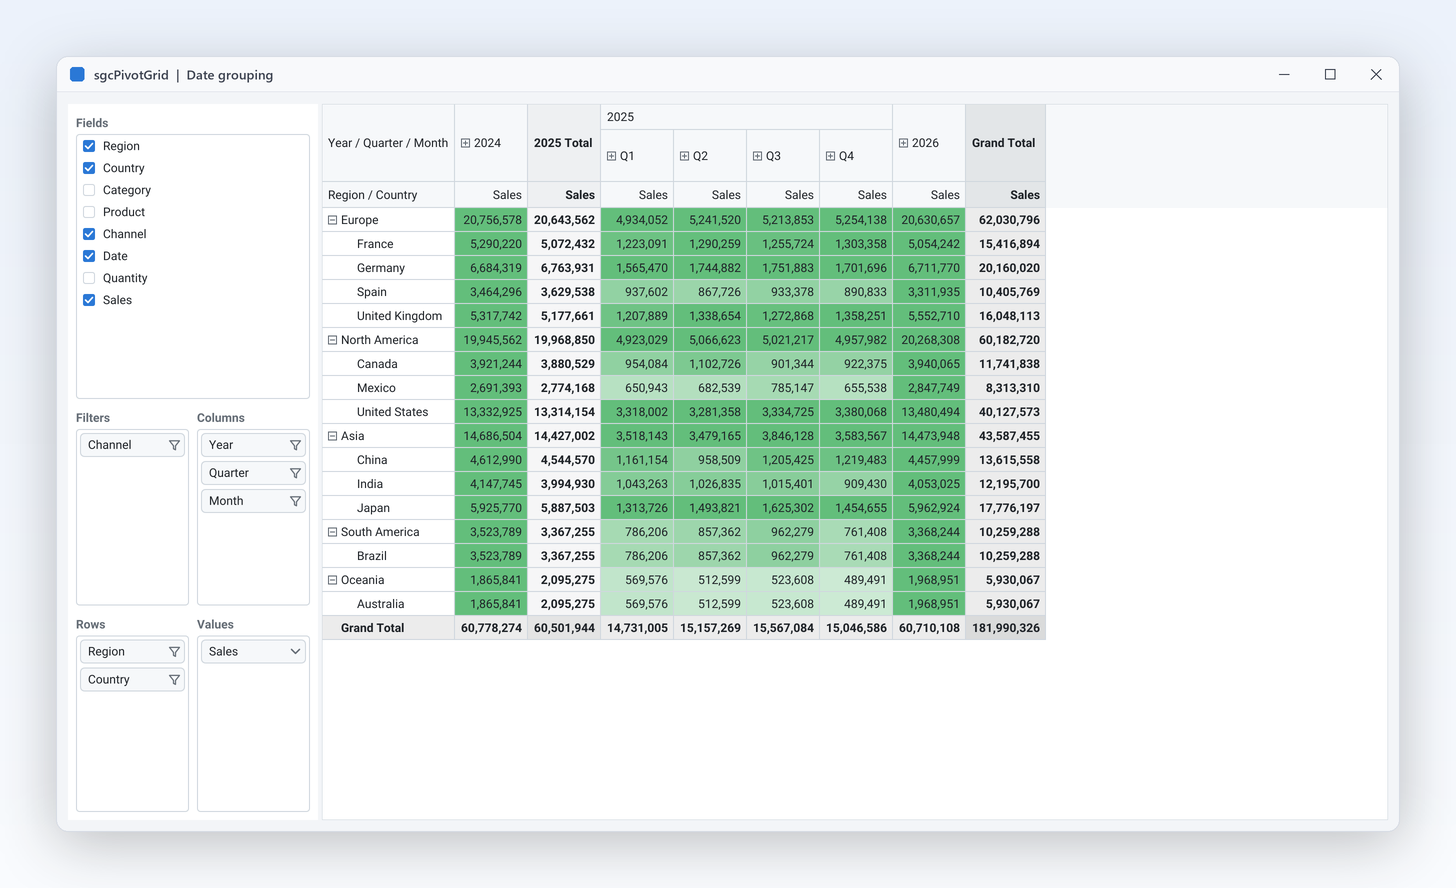
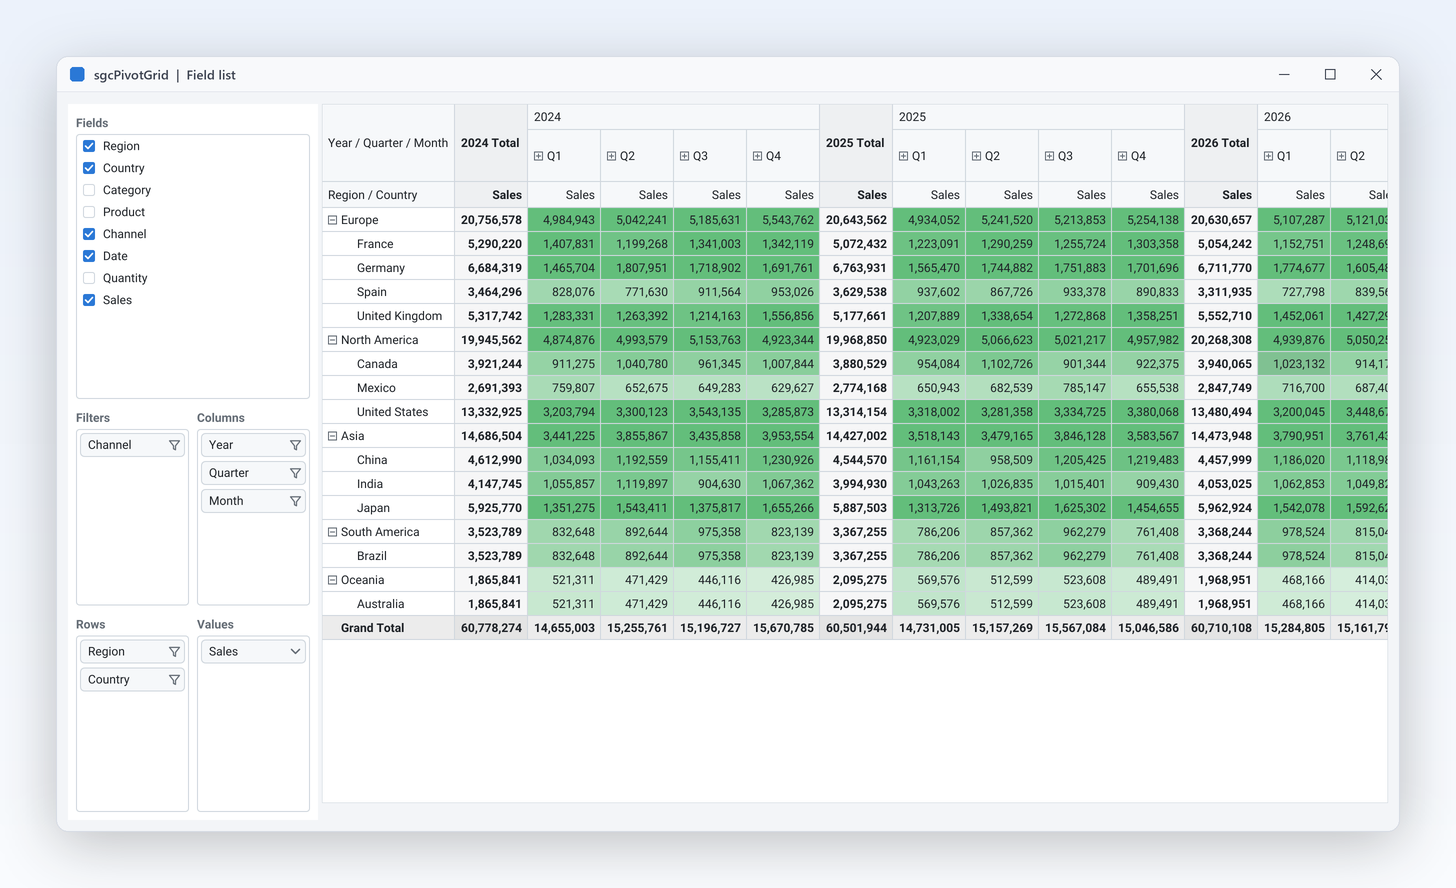
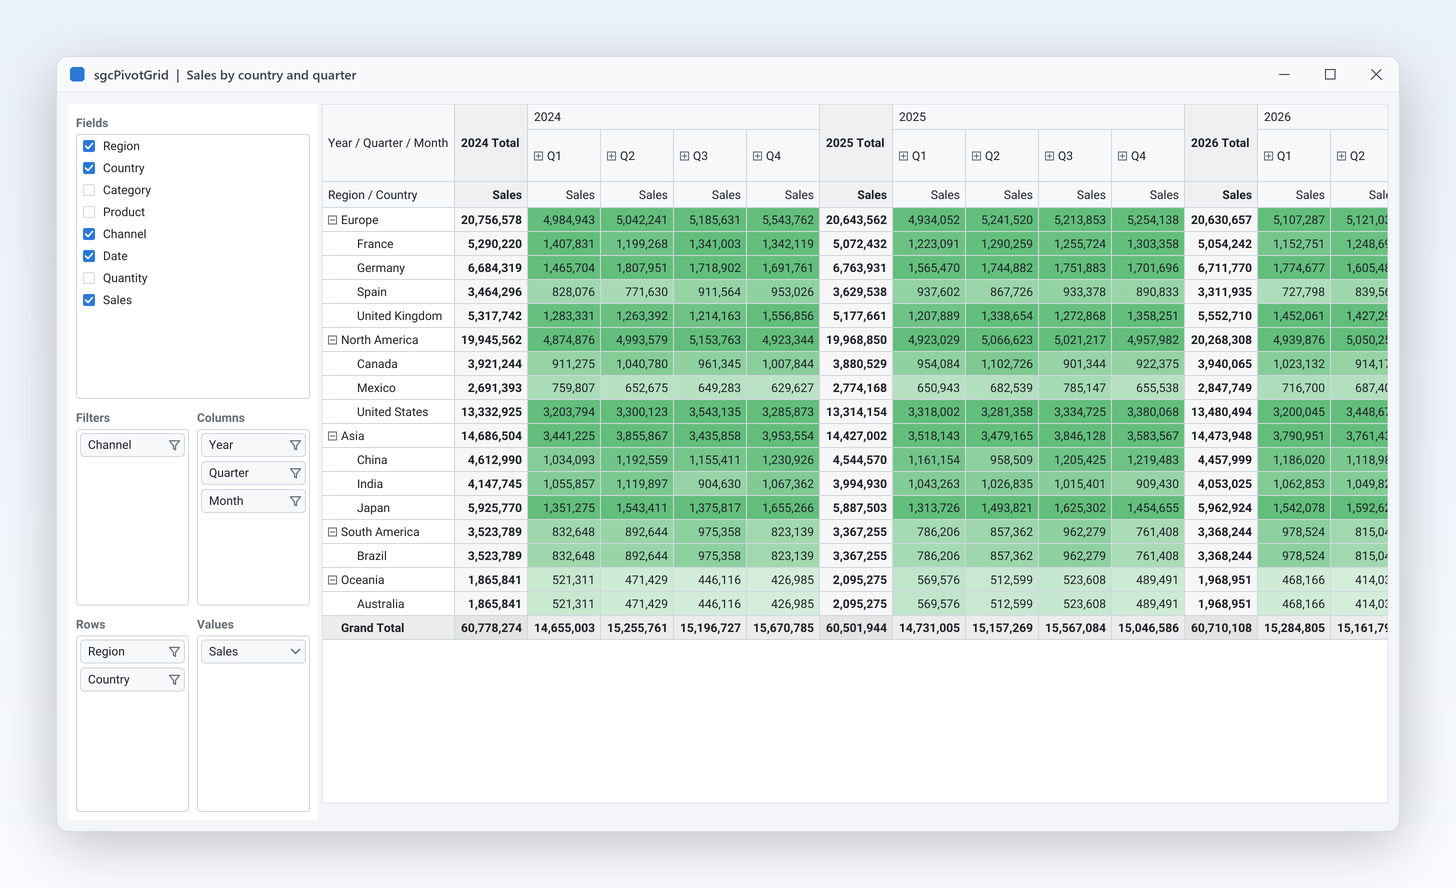
Pivot with 2025 expanded to quarters and months and 2024 collapsed
Analysis

Group dates the way people think.

  • AddField('Date', pvaColumn, pvdQuarter) adds one level per call, from pvdYear down to pvdDay.
  • Users open and close the levels with the plus and minus buttons, and ExpandLevel does it from code.
  • Subtotals and grand totals come with their own position and caption.
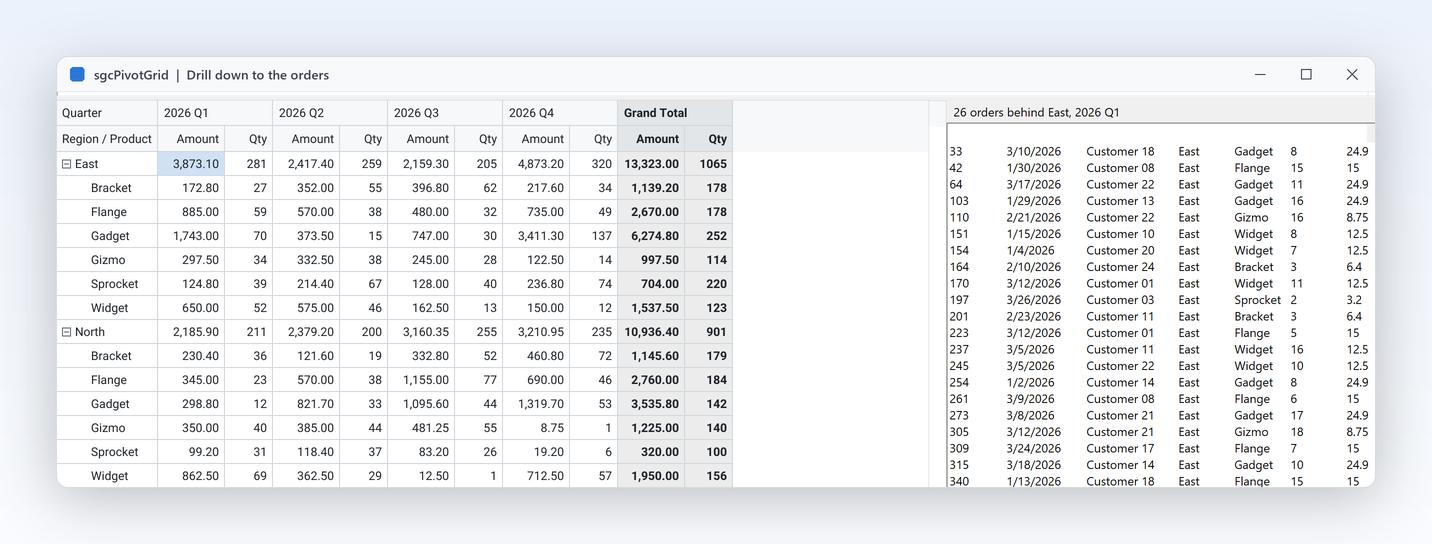
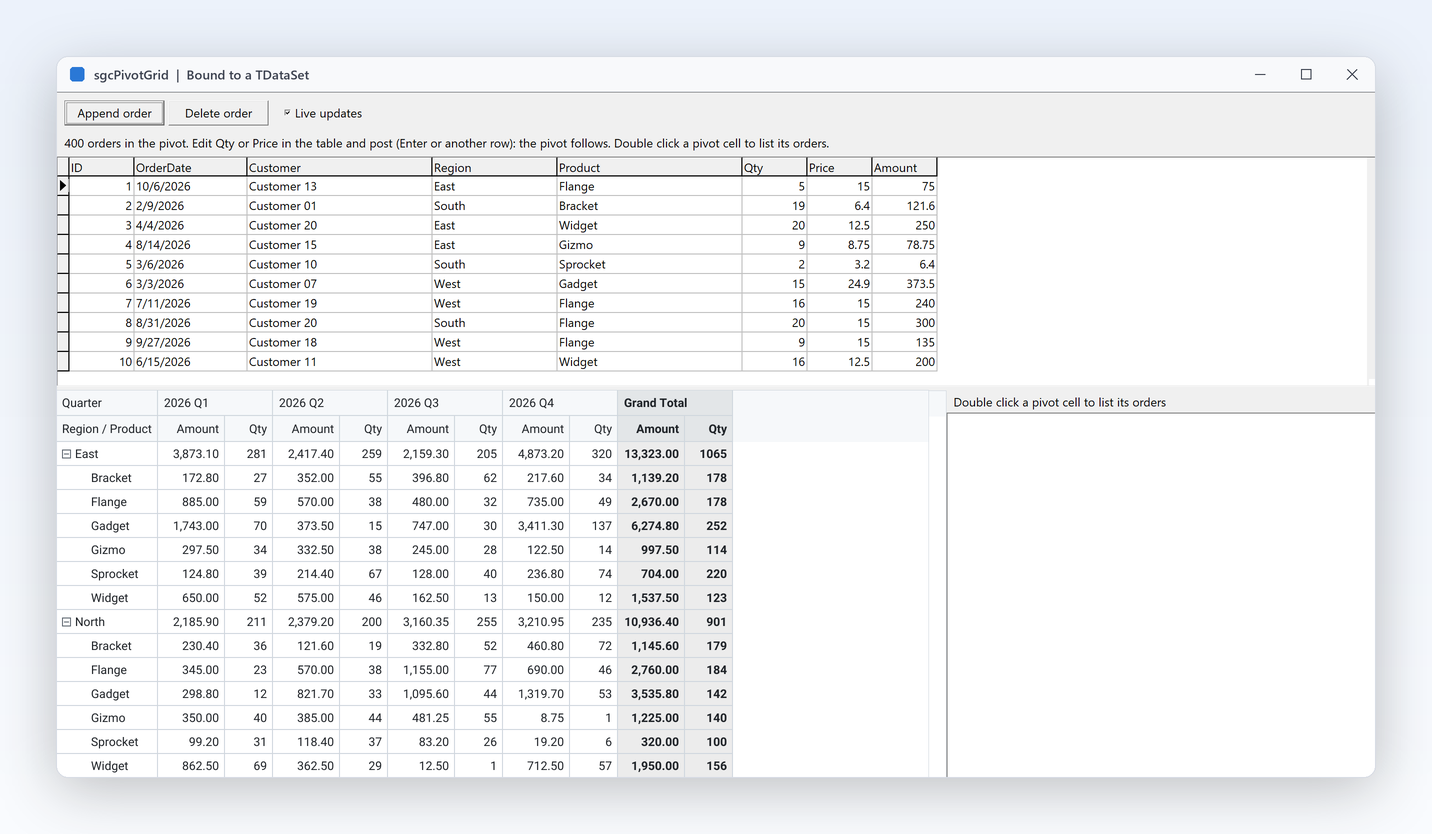
DataSetPivot demo with the orders behind one pivot cell listed beside the grid
Interaction

Drill down to the rows behind any number.

  • A double click on a cell, or Enter on the keyboard, raises OnDrillDown, and DrillDownCell triggers it from code.
  • DrillDown returns the source rows as an IsgcUITable, with every column of the store.
  • The DataSetPivot demo lists the orders behind a cell in a side panel.
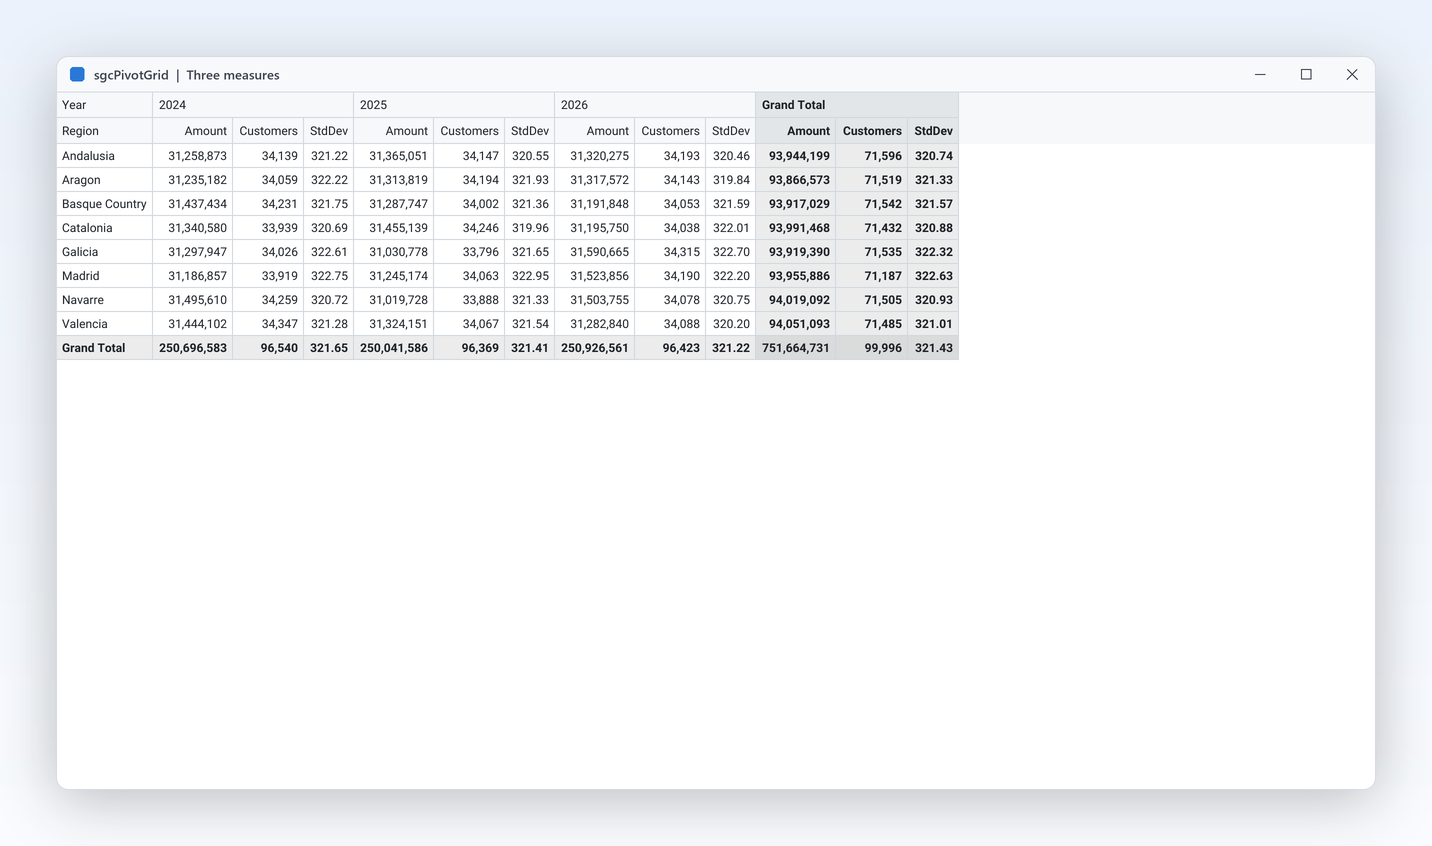
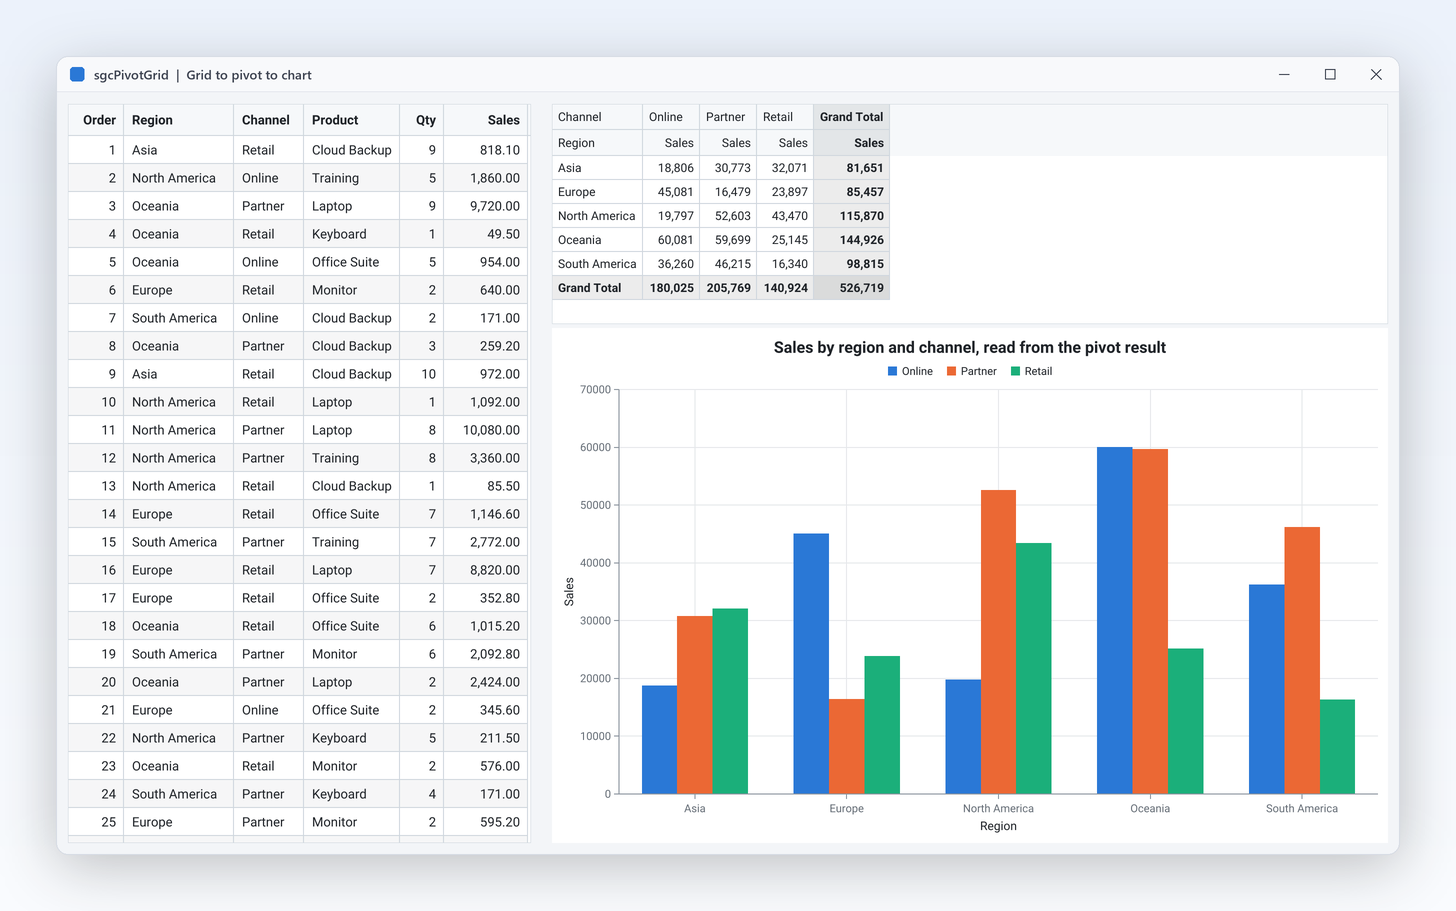
GridToPivotToChart demo: grid rows, the pivot and an sgcCharts chart in three panes
Output

Export what users see, or chart it.

  • SaveToCSV, SaveToJSON, SaveToHTML, SaveToPNG and SaveToSVG write the view as the user arranged it.
  • TsgcPivotGridRenderer draws without a window, on a server or on Linux64.
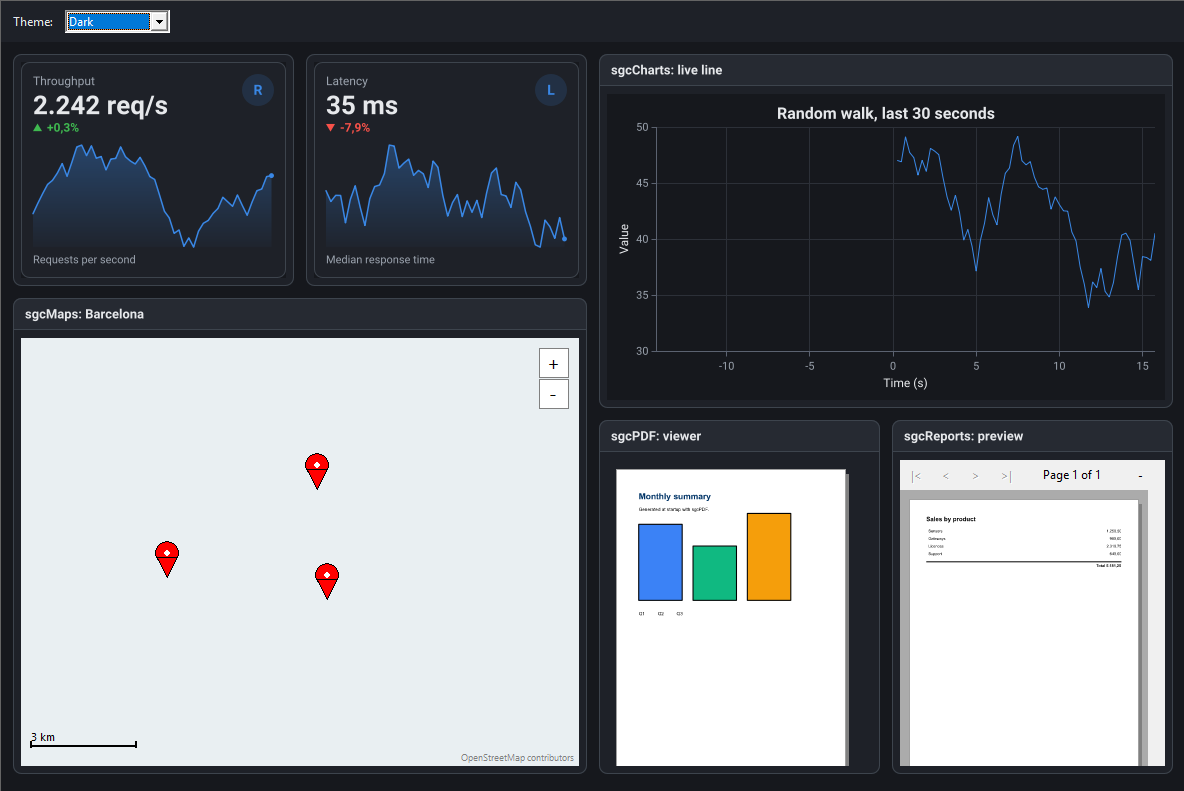
  • ResultTable exposes the visible result to sgcCharts, so grid rows become a pivot and then a chart without copying data.

A pivot table in a few lines.

Load 100,000 rows with one recalculation, then lay out regions by quarter with the largest region first. The same API in Delphi, C++ Builder and C#.

dotnet add package esegece.sgcPivotGrid.WinForms

C++ Builder and C# versions

uses
  Forms, Controls, SysUtils,
  sgcPivotGrid_Types, sgcPivotGrid_Fields, sgcPivotGrid_VCL;

procedure CreatePivot(aForm: TForm);
const
  Regions: array[0..3] of string = ('North', 'South', 'East', 'West');
var
  vGrid: TsgcVCLPivotGrid;
  vField: TsgcPivotField;
  i: Integer;
begin
  vGrid := TsgcVCLPivotGrid.Create(aForm);
  vGrid.Parent := aForm;
  vGrid.Align := alClient;
  // load 100,000 rows, one recalculation at EndLoad
  vGrid.Pivot.BeginLoad(True);
  try
    vGrid.Pivot.DefineColumn('Region', pvtText);
    vGrid.Pivot.DefineColumn('Date', pvtDateTime);
    vGrid.Pivot.DefineColumn('Sales', pvtFloat);
    for i := 1 to 100000 do
      vGrid.Pivot.AppendRow([Regions[i mod 4], EncodeDate(2025, 1, 1) + i mod 365,
        10 + (i mod 97) * 1.5]);
  finally
    vGrid.Pivot.EndLoad;
  end;
  // layout: regions by quarter, the largest region first
  vGrid.Pivot.BeginUpdate;
  try
    vField := vGrid.Pivot.AddField('Region', pvaRow);
    vField.SortBy := pvsValue;
    vField.SortOrder := pvoDescending;
    vGrid.Pivot.AddField('Date', pvaColumn, pvdQuarter).Caption := 'Quarter';
    vGrid.Pivot.AddDataField('Sales', pvfSum);
  finally
    vGrid.Pivot.EndUpdate;
  end;
end;
Part of sgcUI.

Buy sgcPivotGrid on its own, or get it in sgcUI Enterprise, next to all the products that share its theme and runtime. Each comes with source code.

On its own

sgcPivotGrid

The pivot grid and field list on their own, full source code and 1 year of updates.

€249 / developer
sgcPivotGrid pricing

Standard

sgcGrid, sgcNavigation, sgcToolbar and sgcEditors.

€380 / developer
See Standard

Professional

Standard plus sgcCharts, sgcDashboard and sgcGauges.

€529 / developer
See Professional
Includes sgcPivotGrid

Enterprise

All 14 sgcUI products.

€699 / developer
See Enterprise

For .NET, esegece.sgcPivotGrid.Community on NuGet is free. sgcPivotGrid is also in the All-Access bundle.

Explore sgcUI

Put sgcPivotGrid in your own application today.

Download the trial and run the SalesPivot, DataSetPivot and MillionRows demos, or browse every feature first.

Latest from the blog

View all posts →

You are seeing the sgcPivotGrid view of eSeGeCe.

Show me another angle →
30-Day Money-Back GuaranteeNot satisfied? Request a full refund within 30 days of purchase. See refund policy