sgcUI sgcCharts is available right now

sgcCharts. Thirteen series. One chart model.

Line to treemap, candles with SMA, RSI, MACD and Bollinger indicators, live feeds, zoom and drawing tools, and PNG or SVG export. A native chart library for Delphi, C++ Builder and .NET, with source code included.

  • VCL
  • FireMonkey
  • WinForms
  • WPF
  • Avalonia
  • Delphi 7 to 13
  • 13series types on one chart model, line to funnel
  • 1,000,000points in the LiveLine ring buffer, fed from a background thread
  • 4points per pixel column at most with dmMinMax decimation
  • 5UI frameworks: VCL, FireMonkey, WinForms, WPF, Avalonia

Everything a chart library needs.

Dashboards, analytics and trading screens, from a static report to a stream that never stops. sgcCharts covers all of them with one model, on every framework.

  • 13 series types

    Line to funnel, candlestick to treemap, all components on one chart model.

  • Built for streams

    Ring buffers, a time window and per series decimation keep live charts smooth.

  • Your data, bound

    Manual points, CSV, JSON, any TDataSet, an in memory table, or live feeds.

  • Screen or server

    VCL, FireMonkey and .NET views, plus PNG and SVG with no window.

See it run.

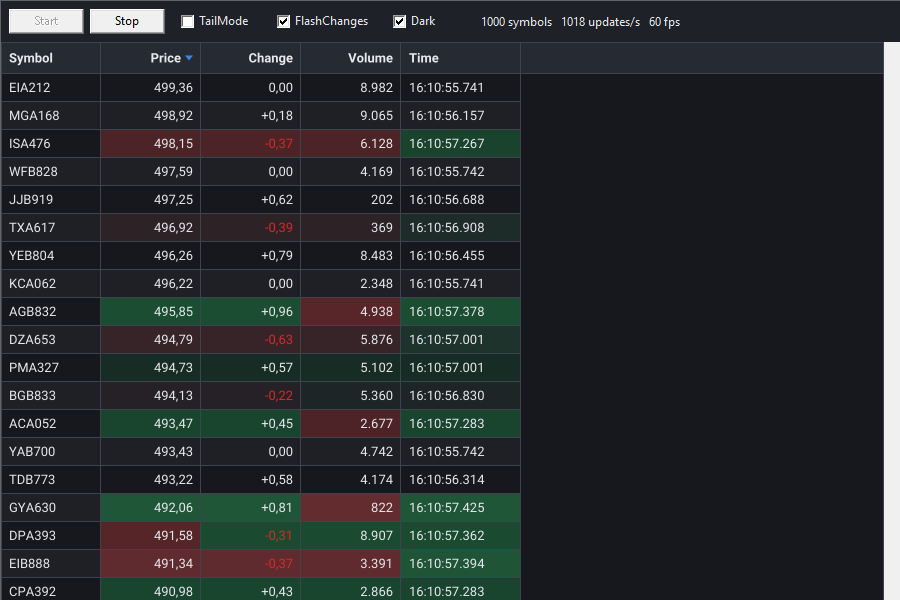
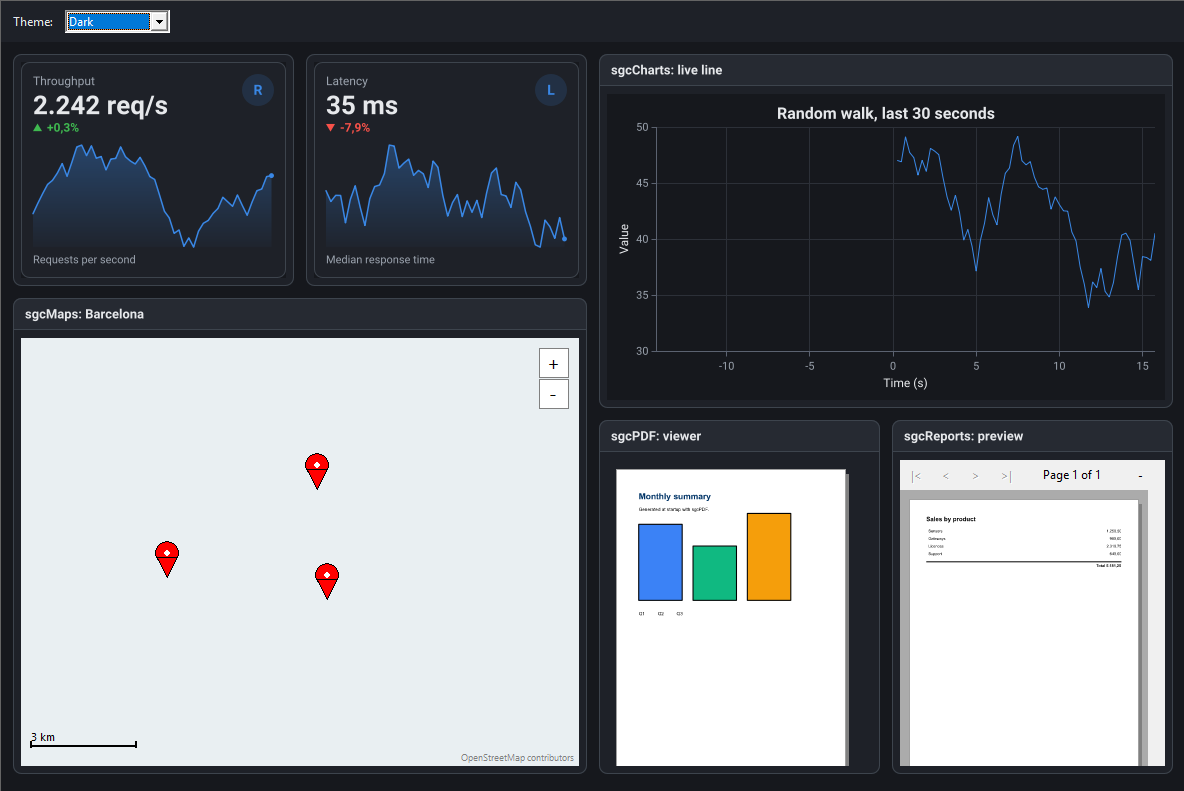
Captured from the sgcCharts demos that ship with the trial.

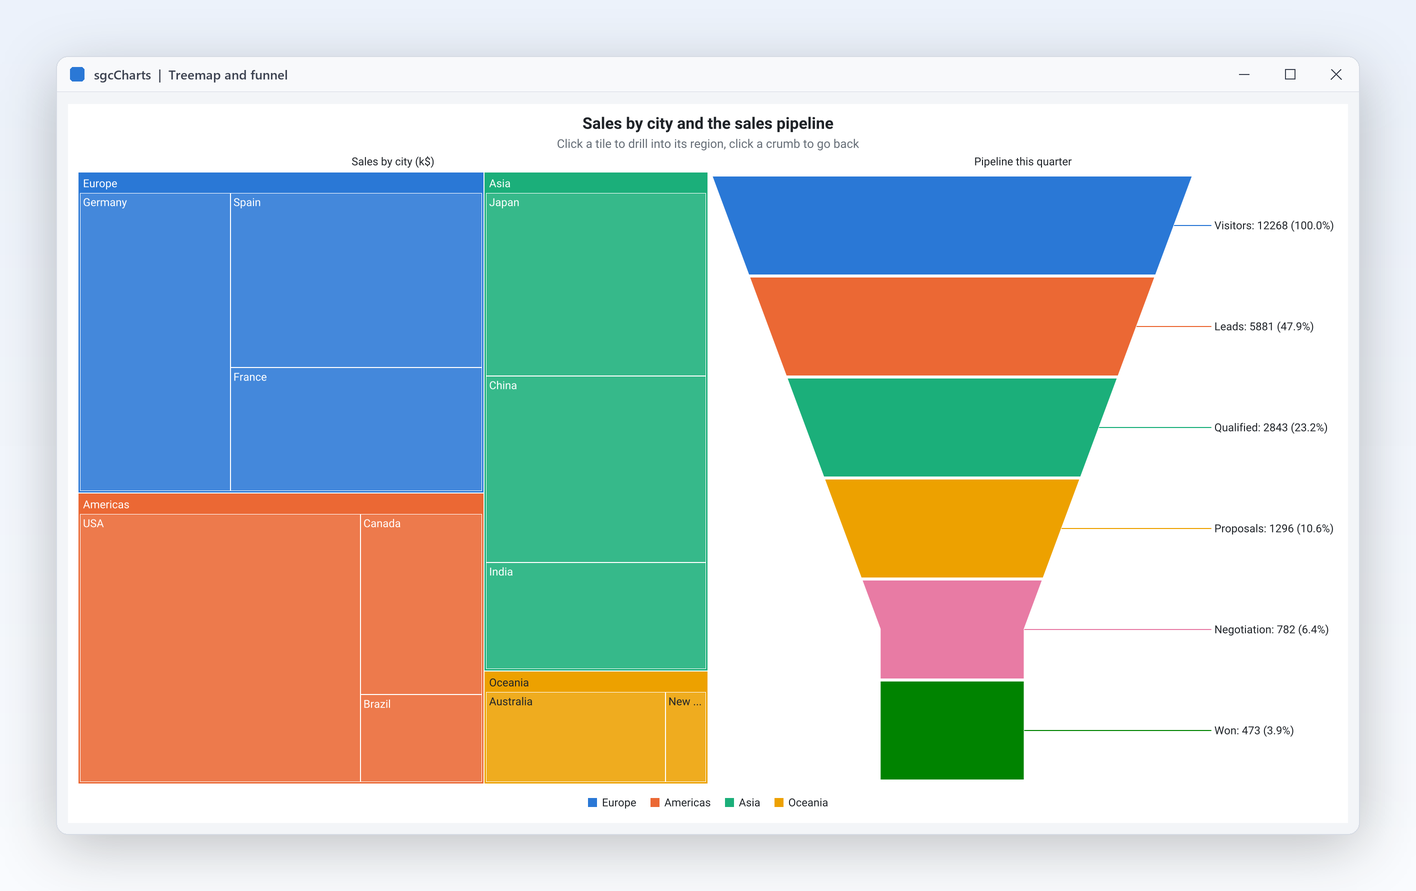
A treemap of sales by city next to a funnel of the sales pipeline with the share kept at each stage
Chart types

Thirteen chart types, one model to learn.

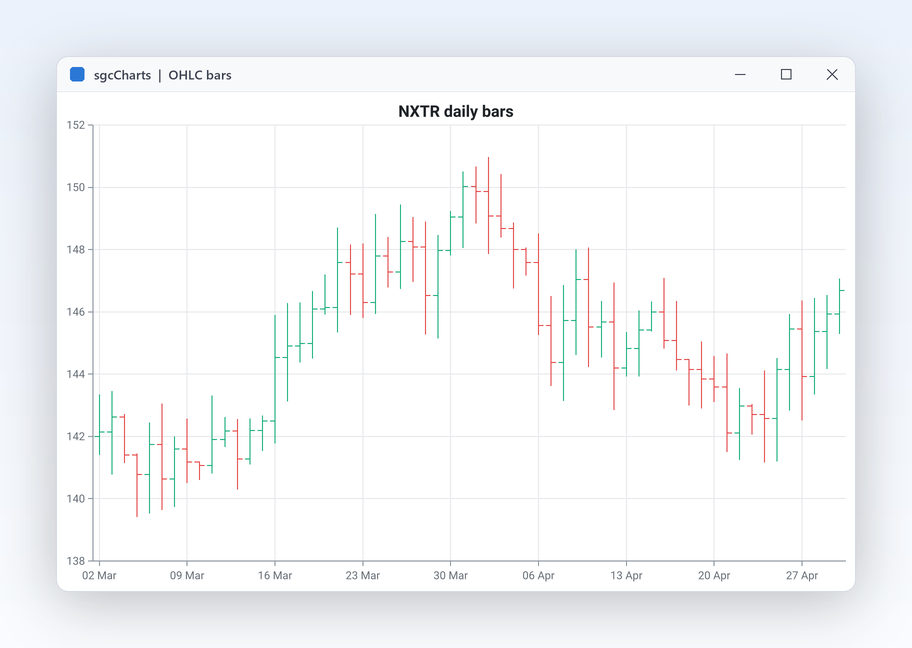
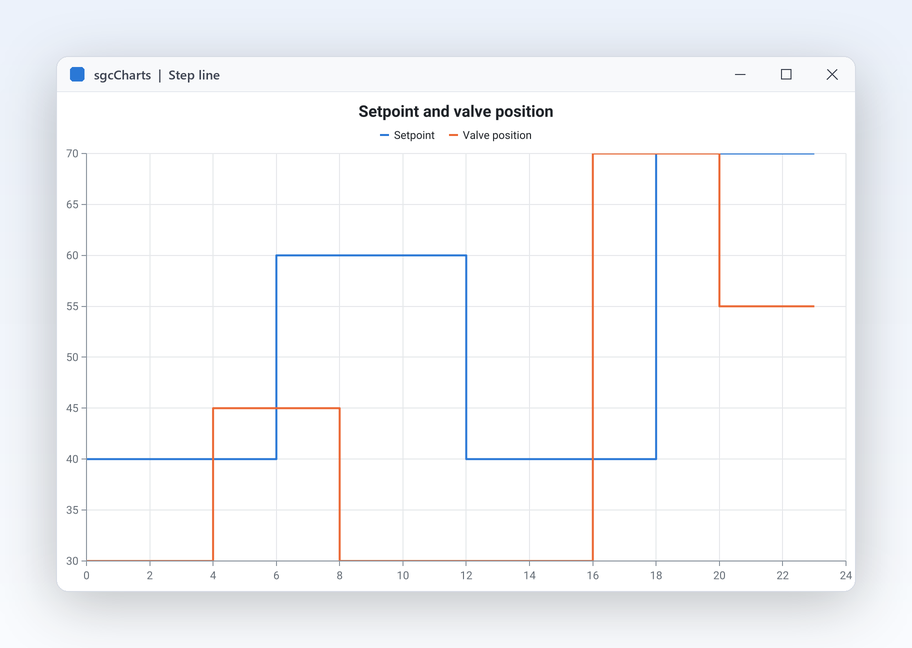
  • Line, fast line, step line, area, bar, scatter, candlestick and OHLC on numeric, date time, logarithmic or category axes.
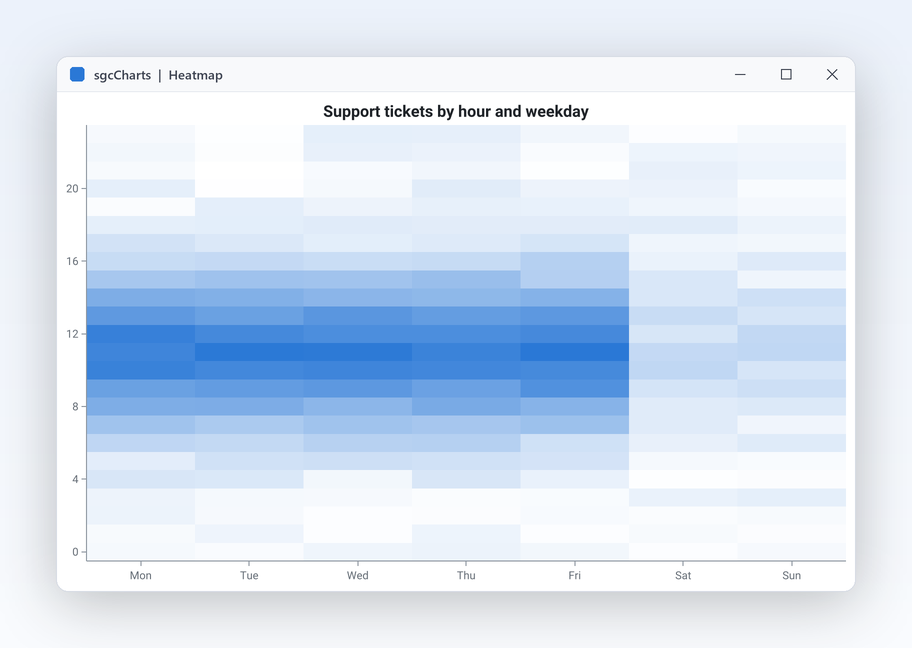
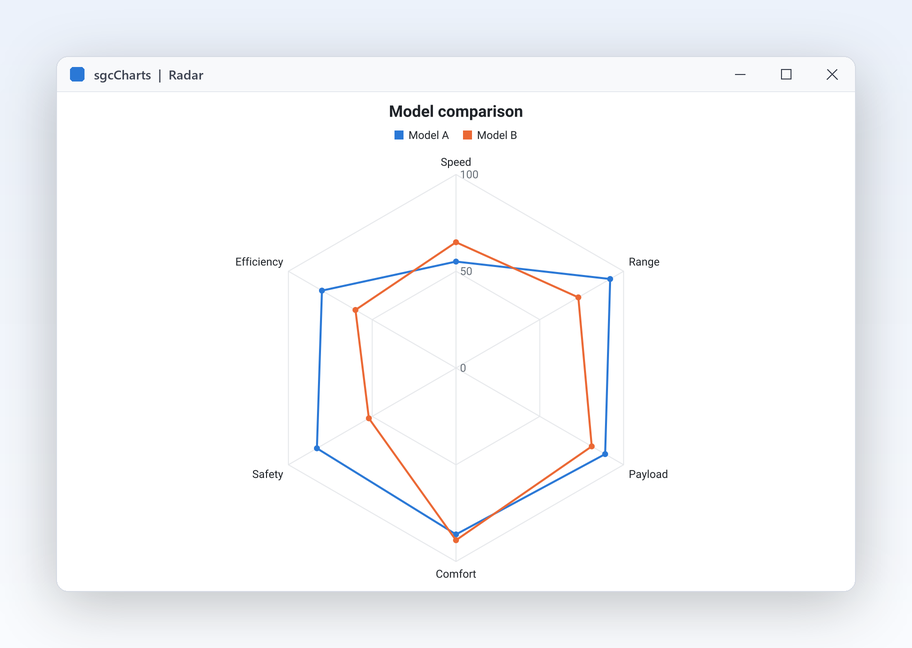
  • Pie and donut, radar, heatmap, treemap and funnel for category data, every series a component you mix freely.
  • TsgcChartSeries_Treemap drills down on click, the funnel shows each stage with its percentage.
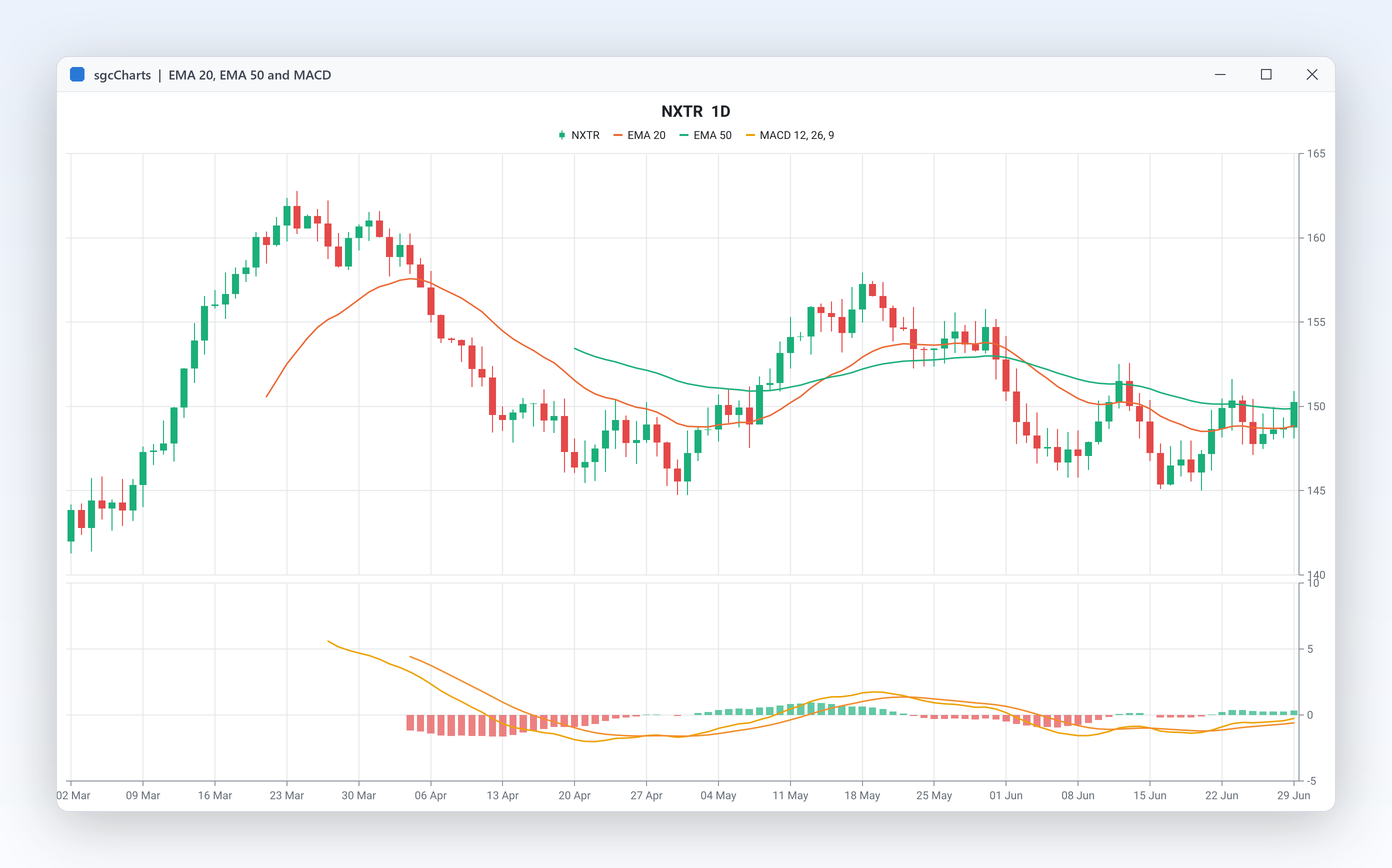
Daily candles with EMA 20, EMA 50 and a MACD 12, 26, 9 indicator series
Financial charts

Indicators without writing the maths.

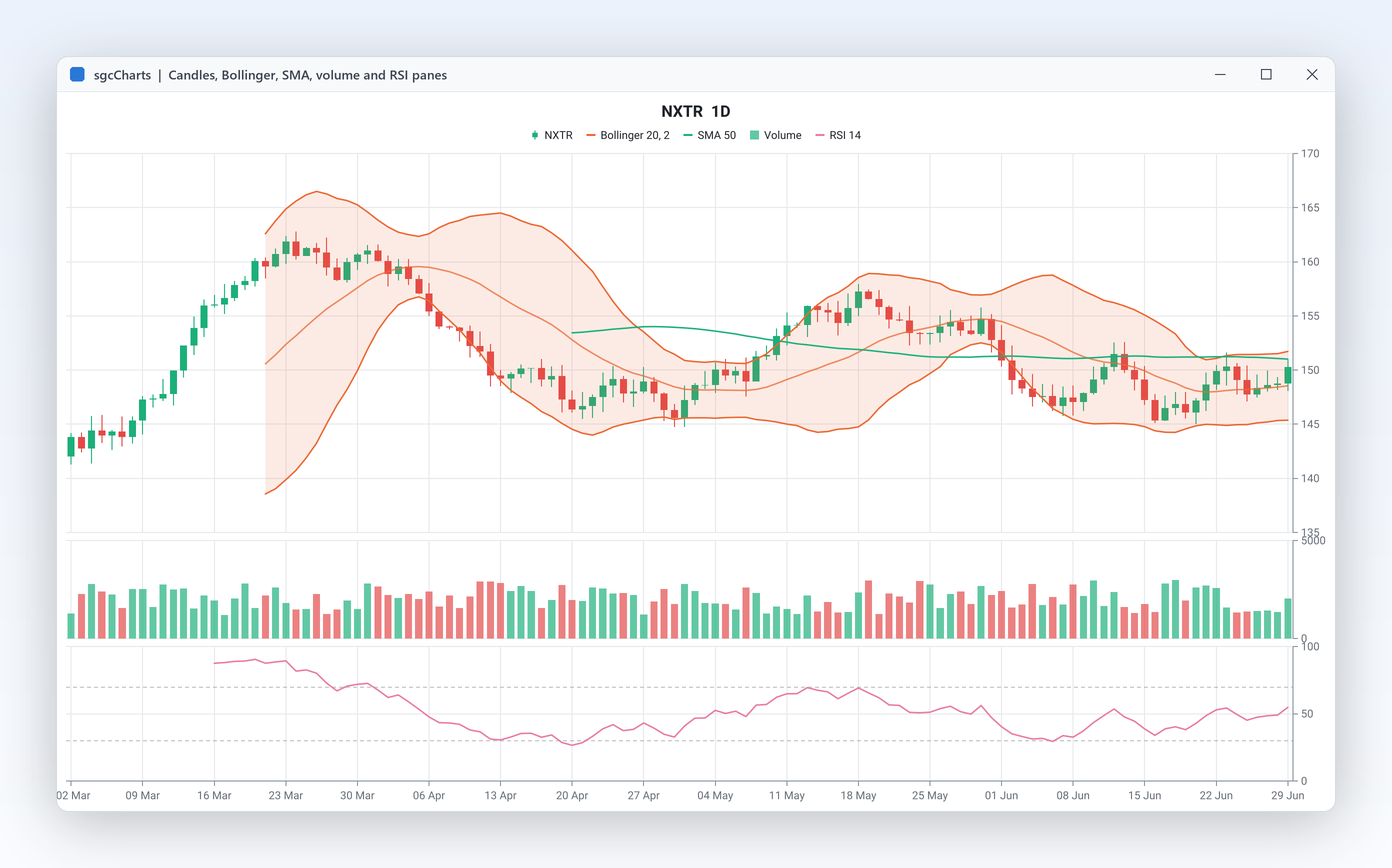
  • Point the Source of SMA, EMA, Bollinger, RSI, MACD, Stochastic, ATR or VWAP at a candlestick series and it recalculates as the candles change.
  • Panes stack price, volume and an oscillator on one time axis, with a last value marker and a bid and ask band.
  • Trend lines, rectangles and Fibonacci retracements stay anchored to the candles when users zoom or pan.
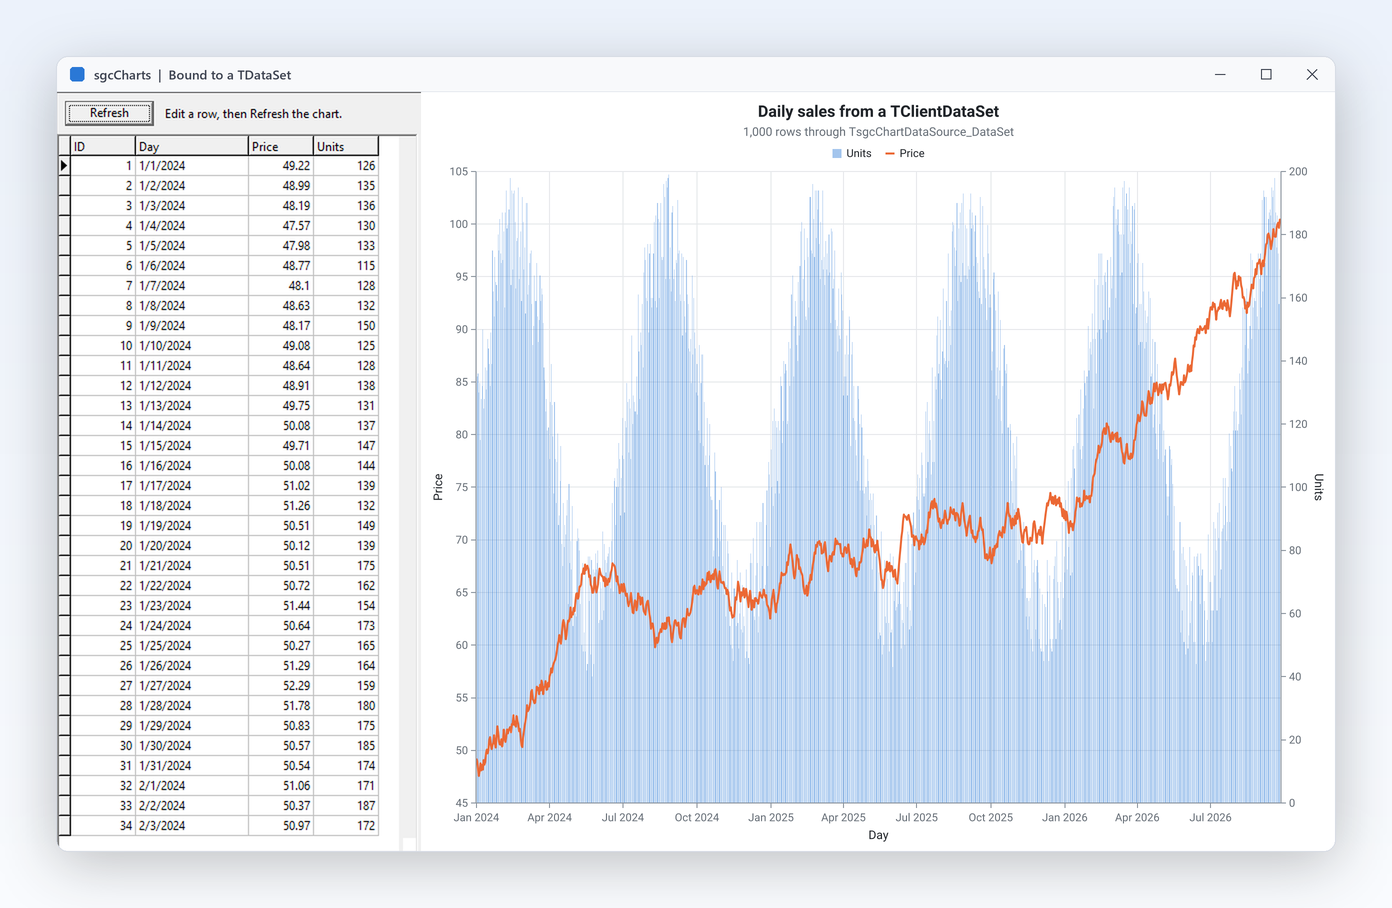
A client dataset shown in a DB grid and read by two dataset sources into a line and a bar series
Data in, images out

Bind the data you already have.

  • TsgcChartDataSource_DataSet reads any TDataSet through XField, YField and LabelField.
  • CSV, JSON and table sources load files, API responses and the rows of an sgcGrid without a loop of AddXY calls.
  • TsgcChartRenderer writes the same chart to PNG or SVG with no window, in a service or on a Linux64 server.
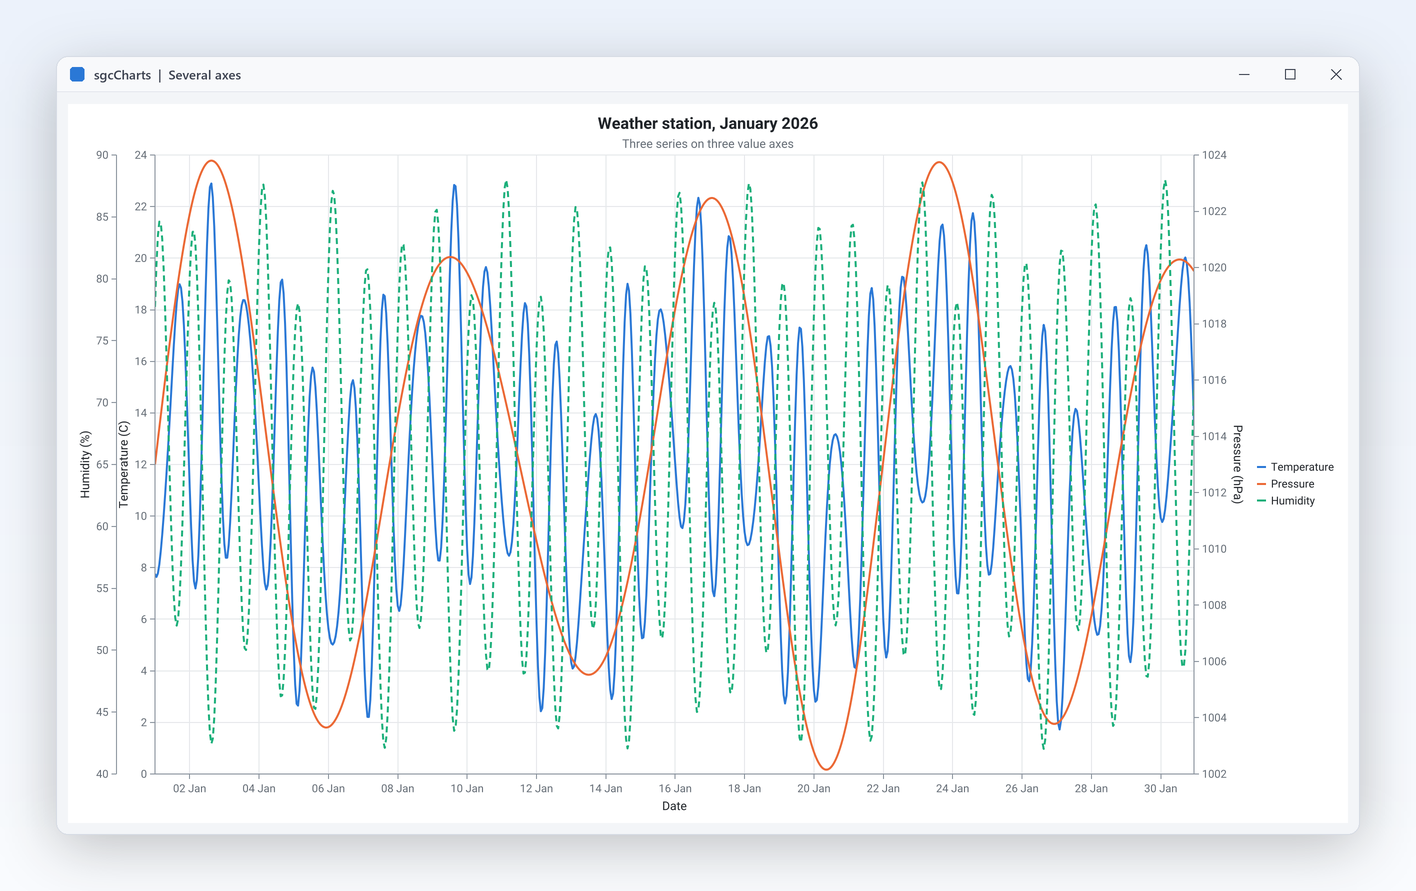
A weather station chart: three series on three value axes
Axes and interaction

As many axes as the data needs.

  • One TsgcChartAxis per scale: numeric, logarithmic, date time or category, on any side of the plot.
  • Wheel zoom, box zoom, pan and touch gestures, with a crosshair and a tooltip that snap to the nearest point.
  • On a streaming chart, zooming pauses the auto scroll and it resumes by itself after AutoScrollResumeDelay.

A donut chart in a few lines.

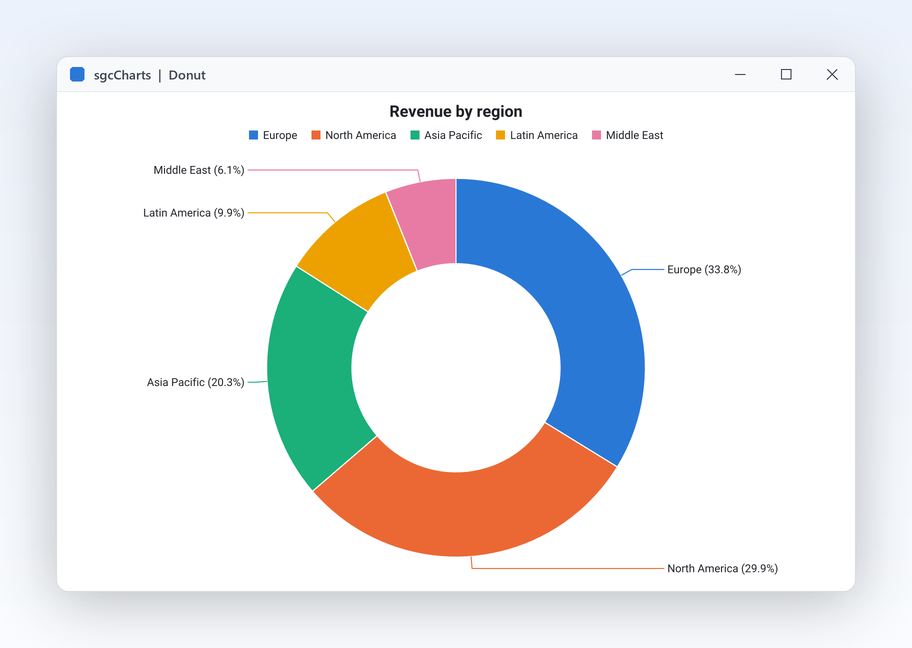
Revenue by region as a donut with an Others slice, on a dark theme, exported to PNG. The same API in Delphi, C++ Builder and C#.

dotnet add package esegece.sgcCharts.Community

C++ Builder and C# versions

uses
  Controls, sgcUICore_Theme, sgcCharts_Chart, sgcCharts_Series_Pie,
  sgcCharts_Renderer, sgcCharts_VCL;

procedure BuildDonut(aOwner: TWinControl);
var
  oChart: TsgcChart;
  oView: TsgcVCLChart;
  oPie: TsgcChartSeries_Pie;
  oPNG: TsgcChartRenderer;
begin
  oChart := TsgcChart.Create(aOwner);
  oChart.Theme := utDark;
  oChart.Title.Text := 'Revenue by region';
  // a pie with a 55 percent hole, small slices folded into Others
  oPie := TsgcChartSeries_Pie.Create(aOwner);
  oPie.Chart := oChart;
  oPie.InnerRadiusPercent := 55;
  oPie.OthersThreshold := 4;
  oPie.OthersText := 'Others';
  oPie.AddItem('North America', 420);
  oPie.AddItem('Europe', 310);
  oPie.AddItem('Asia Pacific', 280);
  oPie.AddItem('Middle East', 12);
  // on screen
  oView := TsgcVCLChart.Create(aOwner);
  oView.Parent := aOwner;
  oView.Align := alClient;
  oView.Chart := oChart;
  // and as a 1200 x 700 PNG, no window needed
  oPNG := TsgcChartRenderer.Create(aOwner);
  oPNG.Chart := oChart;
  oPNG.RenderToPNGFile('revenue.png', 1200, 700);
end;

Part of sgcUI.

Buy sgcCharts on its own, or get it in sgcUI Professional and Enterprise, next to the products that share its theme and runtime. Each comes with source code.

On its own

sgcCharts

The chart library on its own, full source code and 1 year of updates.

€199 / developer
sgcCharts pricing

Standard

sgcGrid, sgcNavigation, sgcToolbar and sgcEditors.

€380 / developer
See Standard
Includes sgcCharts

Professional

Standard plus sgcCharts, sgcDashboard and sgcGauges.

€529 / developer
See Professional
Includes sgcCharts

Enterprise

All 14 sgcUI products.

€699 / developer
See Enterprise

For .NET, esegece.sgcCharts.Community on NuGet is free, without the financial pack and the live feed bridge. sgcCharts is also in the All-Access bundle.

Explore sgcUI

Put sgcCharts in your own application today.

Download the trial and run the LiveLine, Candlestick and DataSetChart demos, or browse every feature first.

Latest from the blog

View all posts →

You are seeing the sgcCharts view of eSeGeCe.

Show me another angle →
30-Day Money-Back GuaranteeNot satisfied? Request a full refund within 30 days of purchase. See refund policy